
Summary
– You can connect and export your GA4 to Google Sheets automatically using manual or automatic methods.
– There are available third-party tools you can use to automate reporting.
– You can integrate GA4 with Google Sheets fast and easier because they are both in the Google ecosystem.
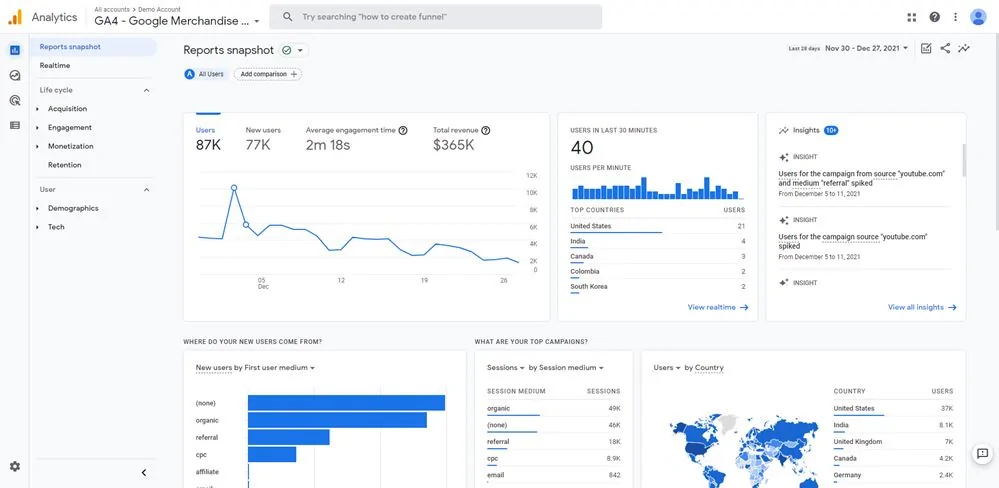
In 2020, Google introduced a new version of Google Analytics–Google Analytics 4 or GA4. It leads the charge in web analytics and Google Analytics 3 (Universal Analytics) is now discontinued on July 1, 2024. Since GA4 is a newcomer, there aren’t that many tools to integrate it with Google Sheets to export data.
You CAN import GA4 data from the API to Google Sheets. You do copy and paste, add new rows manually. It’s an unbearable nightmare and sucks the soul of marketers. This article teaches how to automate reporting step-by-step.
How To Connect and Import GA4 Data to Google Sheets
You need a Google Sheets extension. These extensions are usually paid tools. As mentioned, you can do it manually (for free) to save money. But in perspective, you might want to spend a little bit to save time.
This article shows three options on how to import Google Analytics to Google Sheets:
Option 1 is a FREE Google Sheets extension.
Option 2 is a PAID Google Sheets extension.
Option 3 is another PAID option that uses a third-party connector.
To connect GA4 to Google Sheets, most approaches use similar workflows:
Step 1: Install a Google Sheets extension
Step 2: Configure Settings
Step 3: Run the Configuration
Step 4: Save Data on Google Sheets
Option 1: Free Official Google Sheets Extension
First option is to use the official GA4 Reports Builder for Google Analytics. This is free and is the only free option in this article.
Installing The Google Sheets Extension
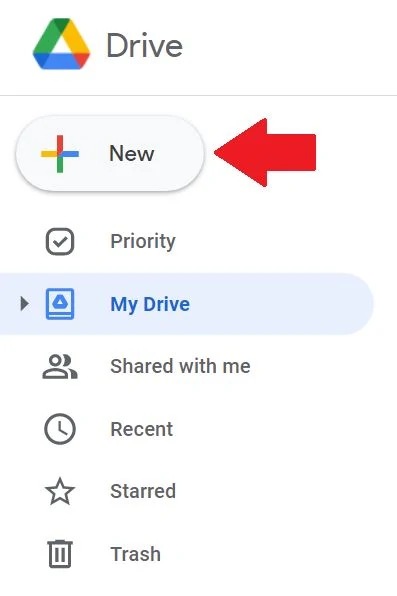
1 – Go to your Google Drive workspace.
2 – Click on + New then create a new Google Sheets file. Name your Google Sheets as well.
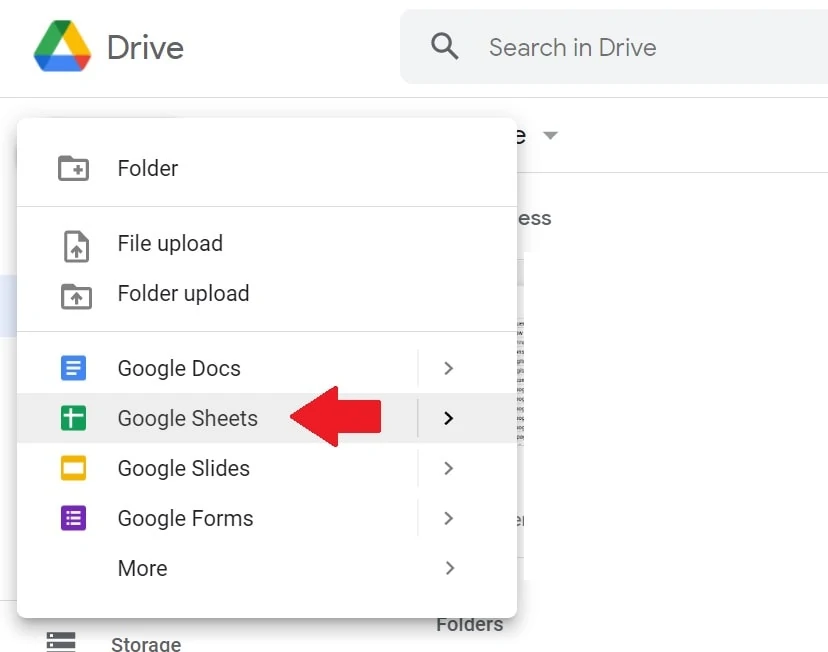
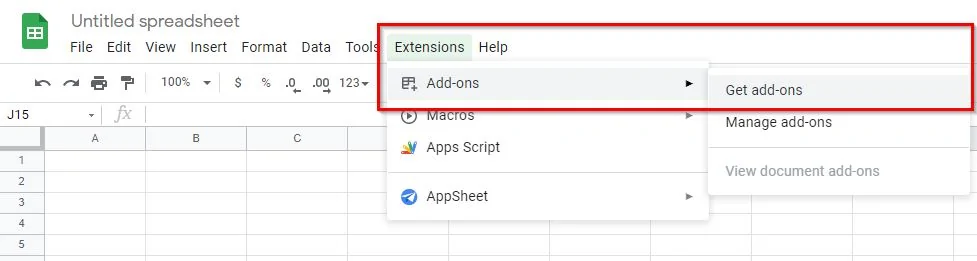
3 – At the top of your file, click on Extensions. Then click on Add-ons. Then click on Get add-ons.
4 – Search for GA4 Reports Builder for Google Analytics. Then install it.
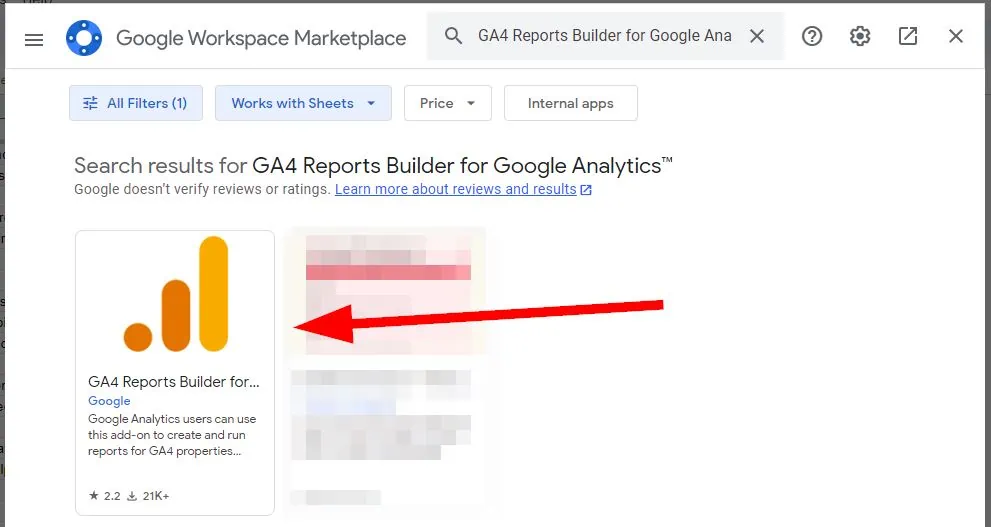
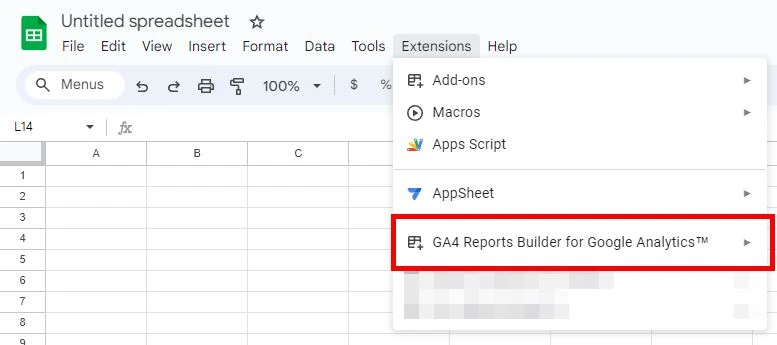
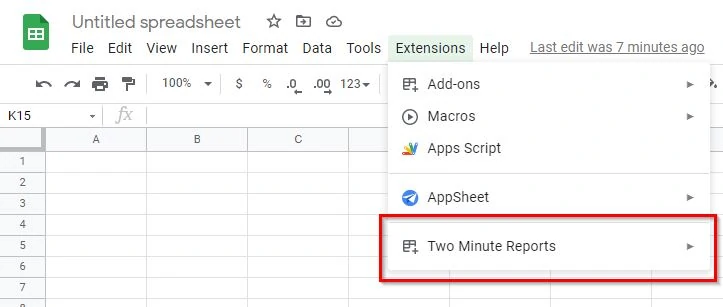
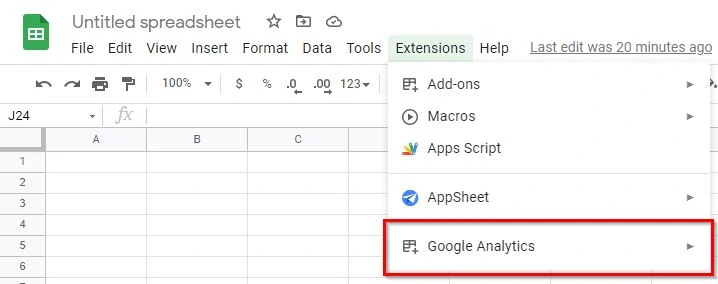
5 – Once installed, the add-on is under Extensions.
Set Up GA4 Data Source
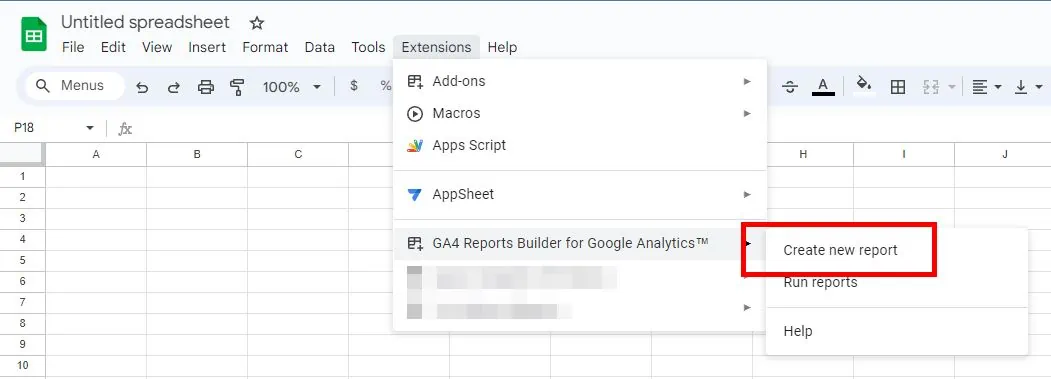
1 – Launch the add-on. Click on Extensions. Then click on GA4 Reports Builder for Google Analytics. Then click on Create new report. A navigation pane on the right side appears.
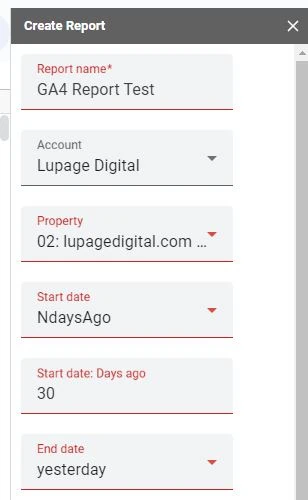
2 – Name your report.
3 – Select the Google Analytics Account and Property where you want to get data from.
4 – Select the appropriate dates from the dropdown.
Note: Make sure you’re familiar with the names and hierarchy of your GA4 setup.
4 – Under Dimensions, select the dimensions you want to import. In this example, add defaultChannelGroup.
5 – Under Metrics, select the metrics you want to import. In this example, add sessions and conversions.
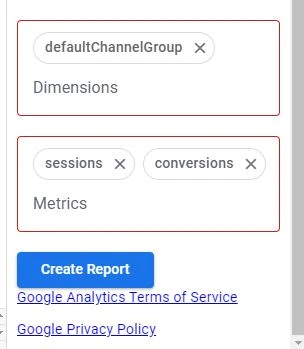
5 – Click on Create Report.
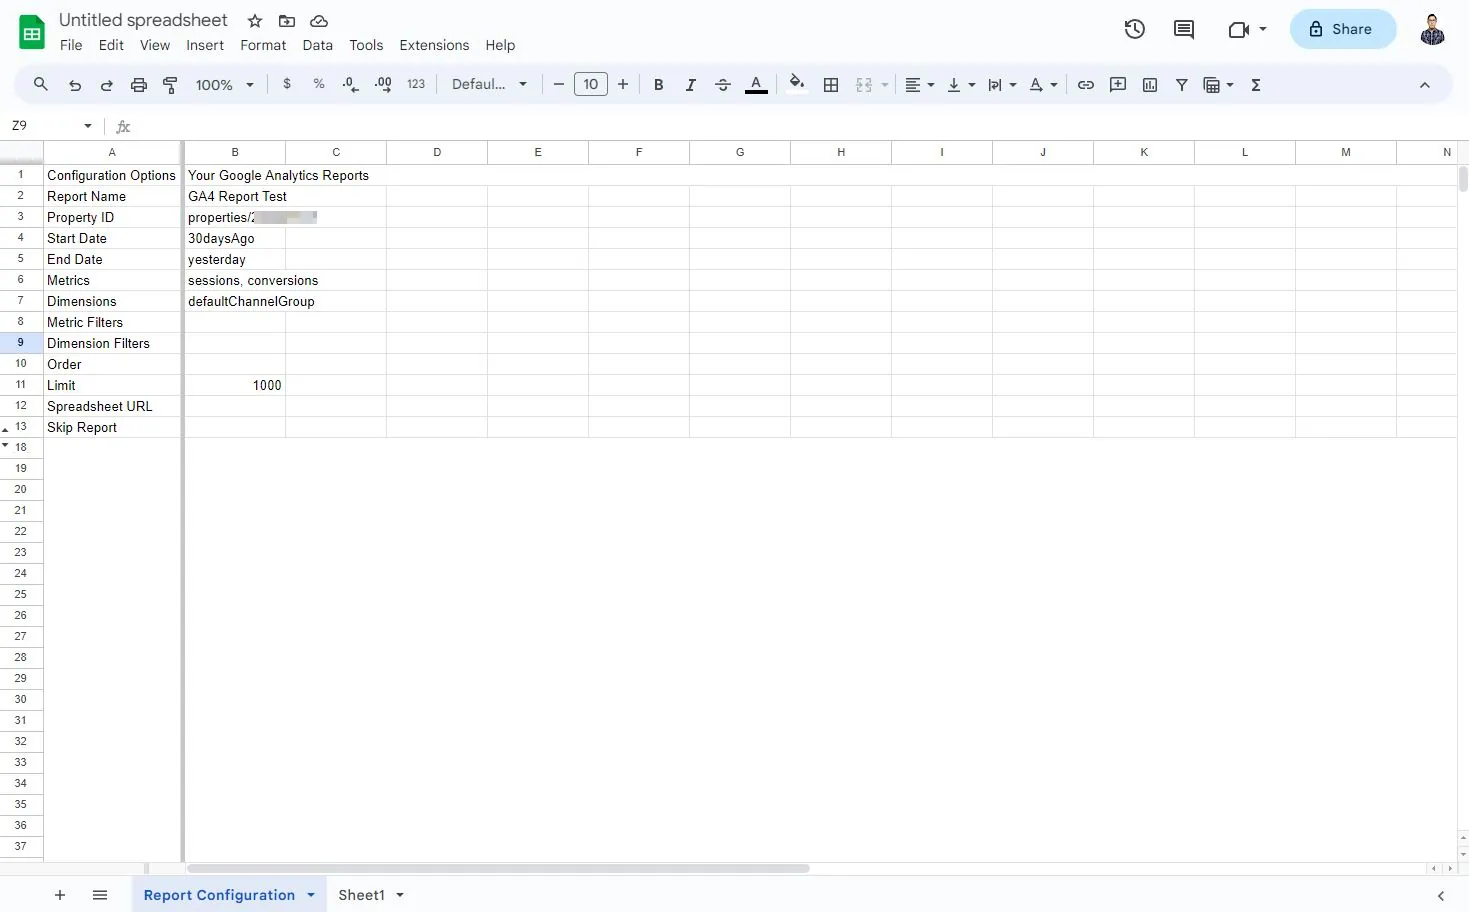
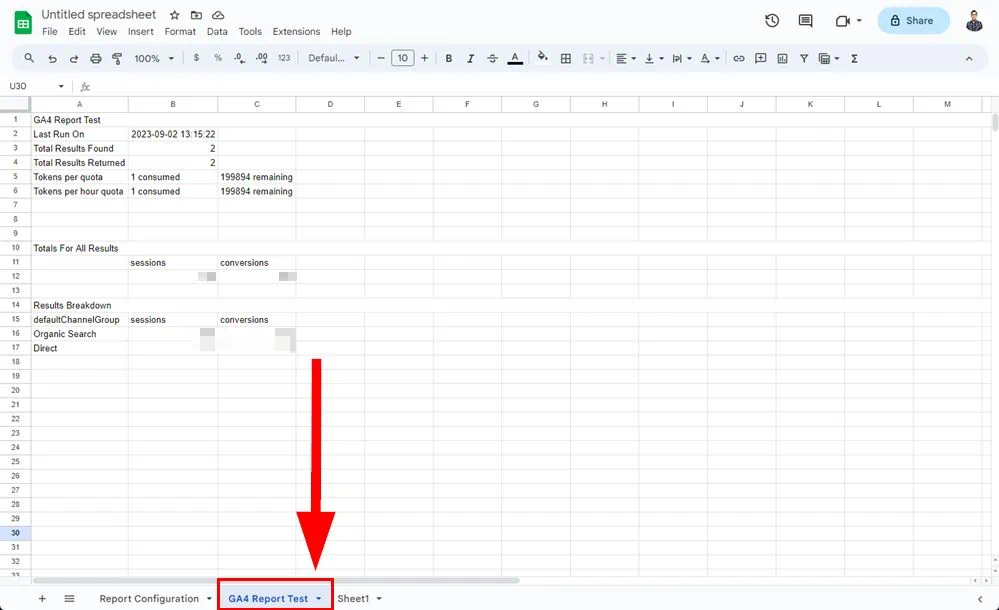
Note: This doesn’t create the actual report just yet. This section only syncs up the data sources. The results looks like this:
Running GA4 Reports
This allows the API (application programming interface) to get data from GA4 without errors.
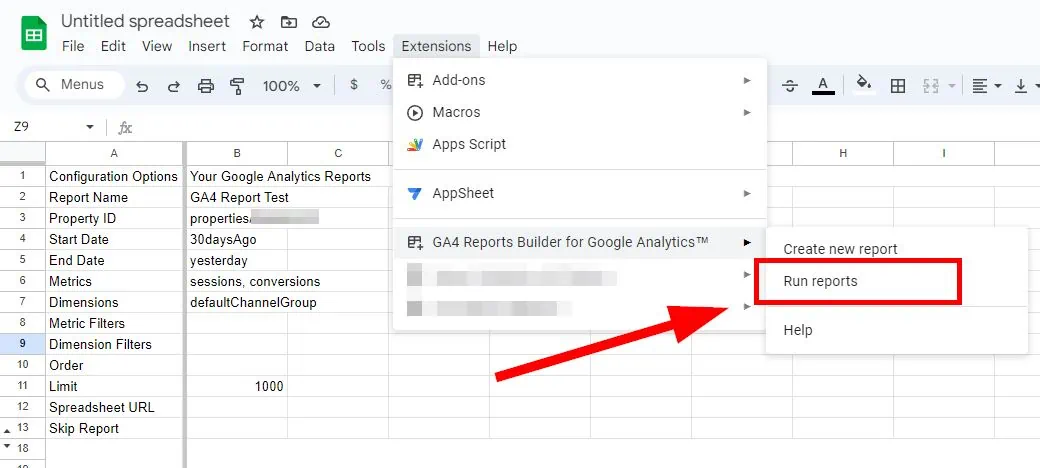
1 – At the top of your file, click on Extensions. Then click on GA4 Reports Builder for Google Analytics, then click on Run reports.
2 – If setup is correct, the API runs the query. You get a success notification. Click on OK.
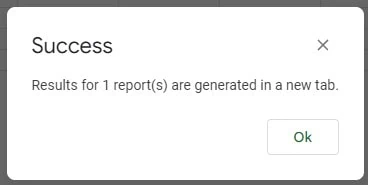
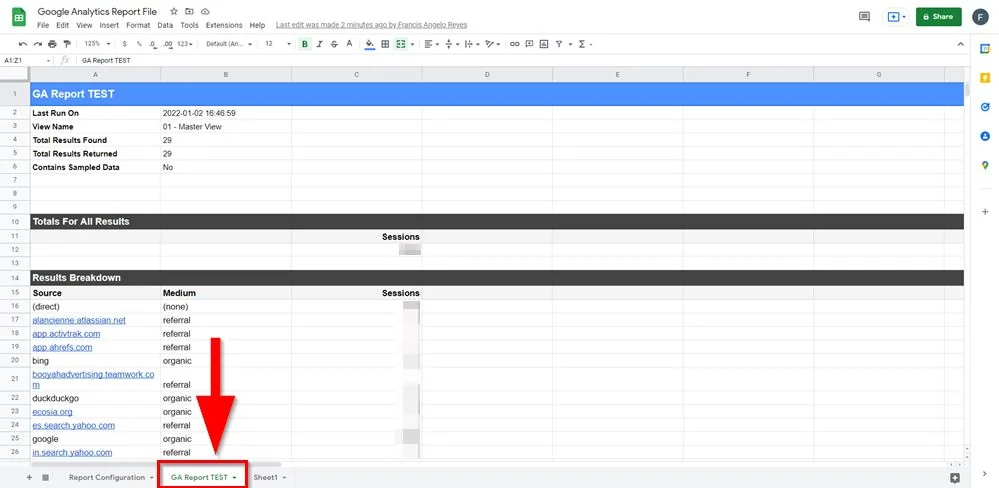
A new Google Sheets tab is created, and that contains the report.
Running Other Google Analytics Reports
Of course there are cases where you want to run reports for other dimensions and metrics. This part becomes tricky since you need to replace some of the fields.
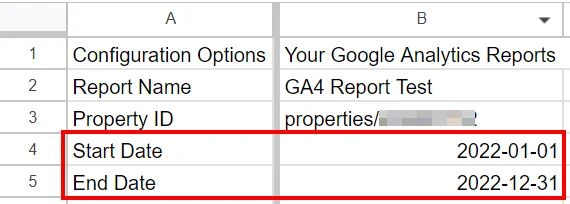
1 – Go back to Report Configuration sheets tab. This is where you replace some of the fields.
2 – For Start Date, change it based on your use case in YYYY-MM-DD format. In this example, use 2022-01-01 for January 01, 2022.
3 – For End Date, same thing. Change it based on your use case in YYYY-MM-DD format. In this example, use 2022-12-31 for December 31, 2022.
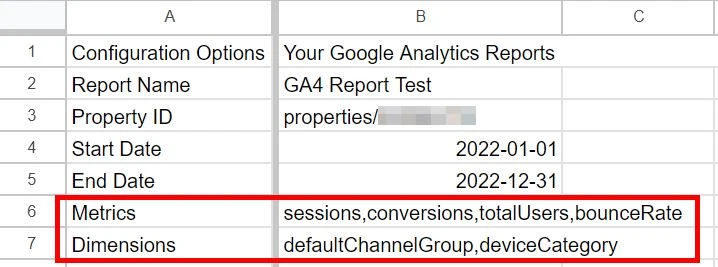
For Metrics and Dimensions, you need to consult and understand the API schema documentation of GA4.
4 – Under Metrics, you may add total users and bounce rate. These parameters are separated by comma.
sessionsconversionstotalUsersbounceTate
5 – Under Dimensions, you may add Device category. These parameters are separated by comma.
defaultChannelGroupdeviceCategory
You may leave the Order and other fields untouched for now.
6 – At the top of your file, click on Extensions. Then click on GA4 Reports Builder for Google Analytics, then click on Run reports again.
7 – If setup is correct, the API runs the query. You get a success notification again. Click on OK.
8 – Go back to the sheets tab that contains the report. The sheet is now updated with new data points.
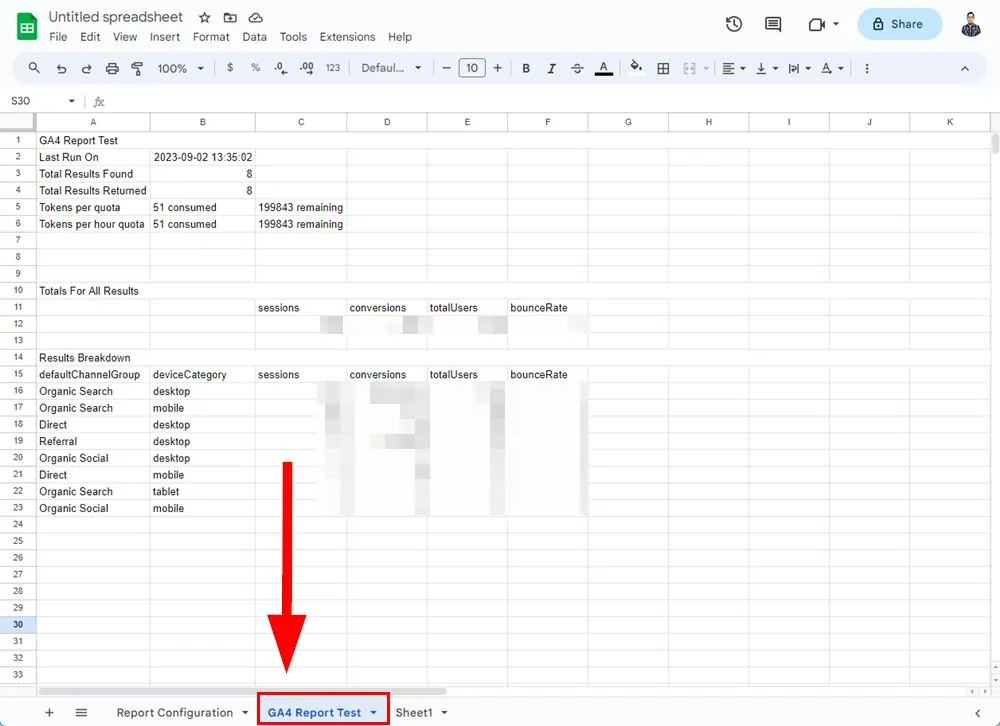
Viola! You imported your GA4 data to Google Sheets!
Option 2: Paid Google Sheets Extension
Use Two Minute Reports in this use case. Two Minute Reports imports data from the GA4 API directly to Google Sheets in minutes. No required coding skills. Another Google Sheets extension to use is Supermetrics.
Installing a Google Sheets Extension
1 – Go to your Google Drive workspace.
2 – Click + New then create a new Google Sheets file.
3 – At the top of your file, click on Extensions. Then click on Add-ons. Then click on Get add-ons.
4 – Search for Two Minute Reports. Then install it.
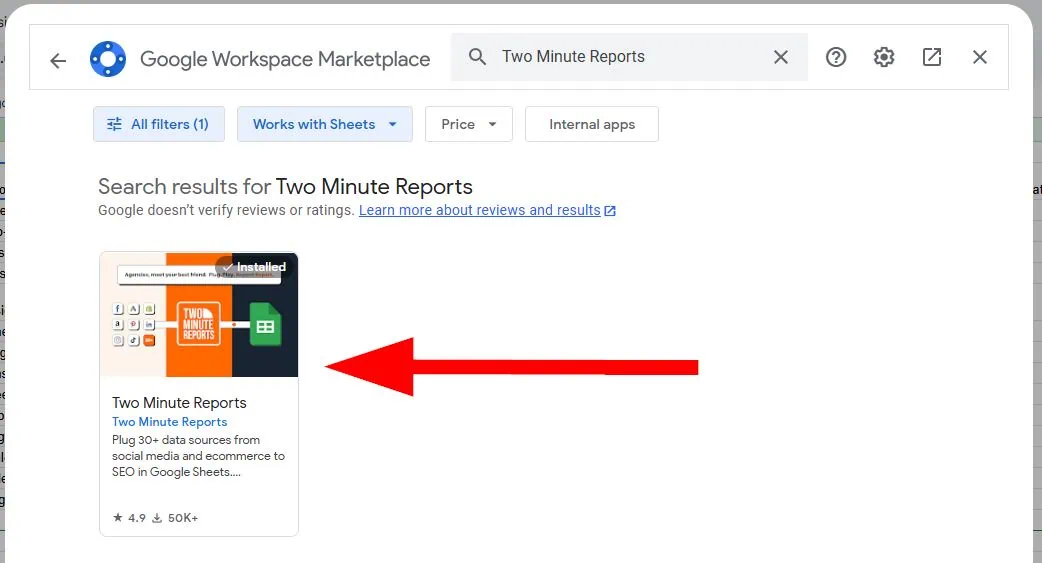
5 – You now have the extension installed on your Google Sheets file.
Import GA4 Data Source
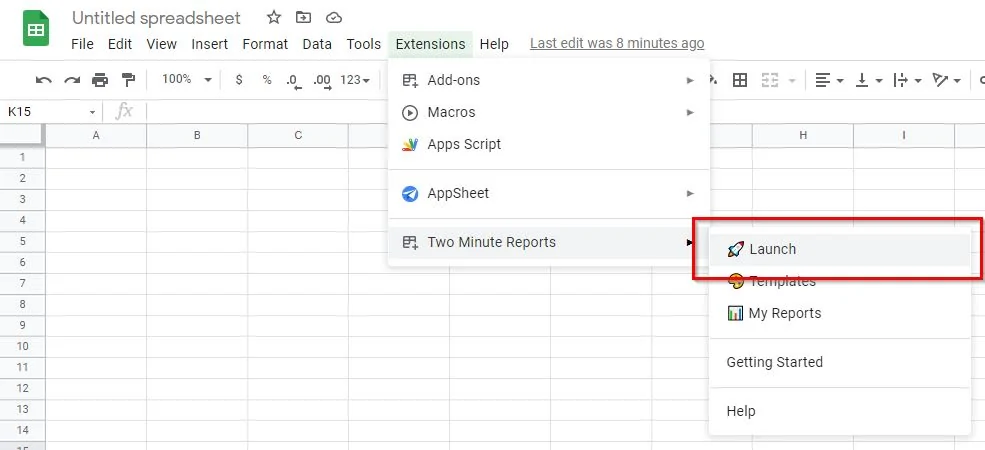
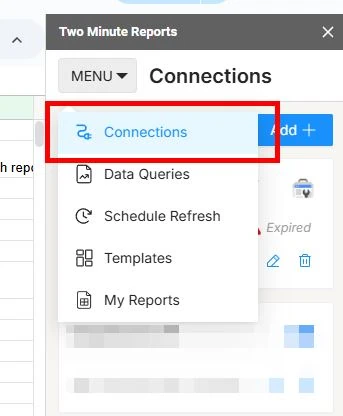
1 – Launch the extension. A navigation pane on the right side appears.
2 – Click on MENU then click on Connections then clickc on Add +.
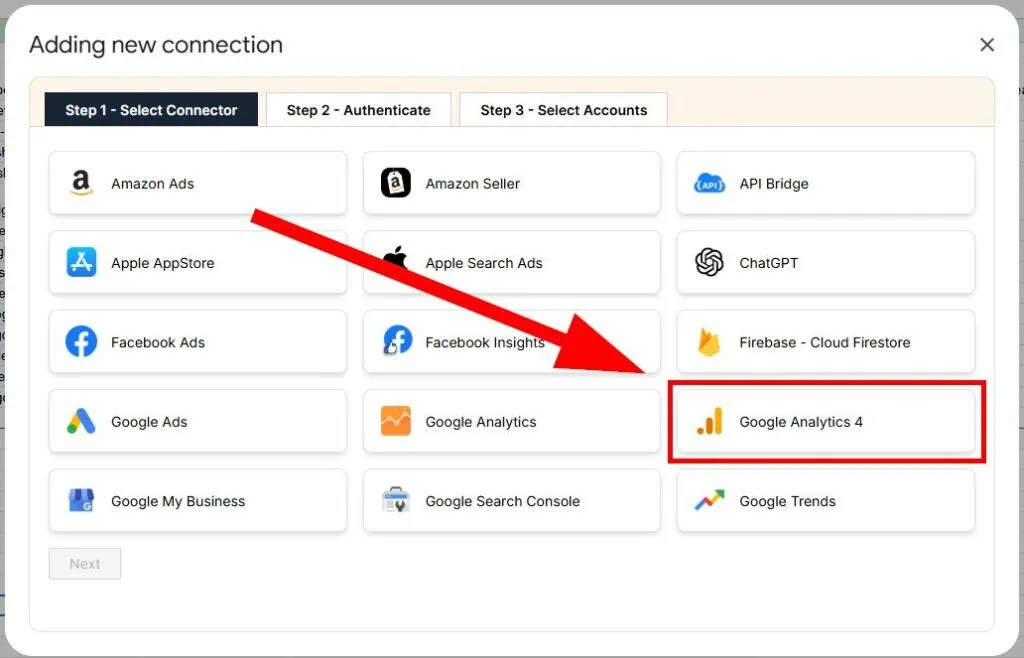
3 – Select Google Analytics 4.
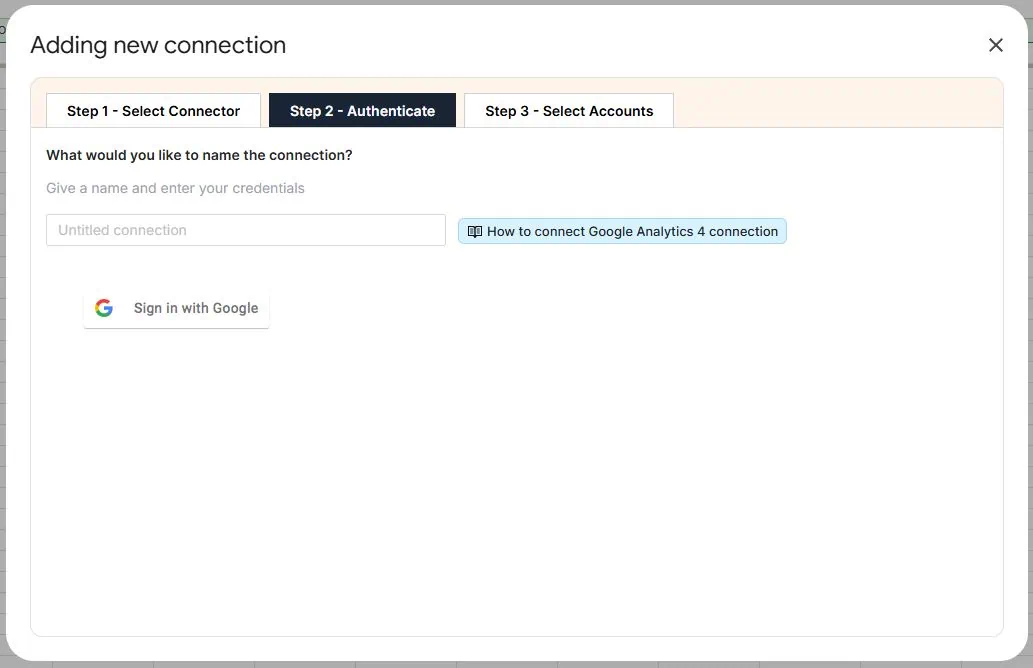
4 – Name your connection. Then sign-in to your GA4 account.
5 – Link your GA4 account to the tool. To be sure, allow and give full access to the tool for seamless integration.
Make sure the account you’re giving access to has access to GA4.
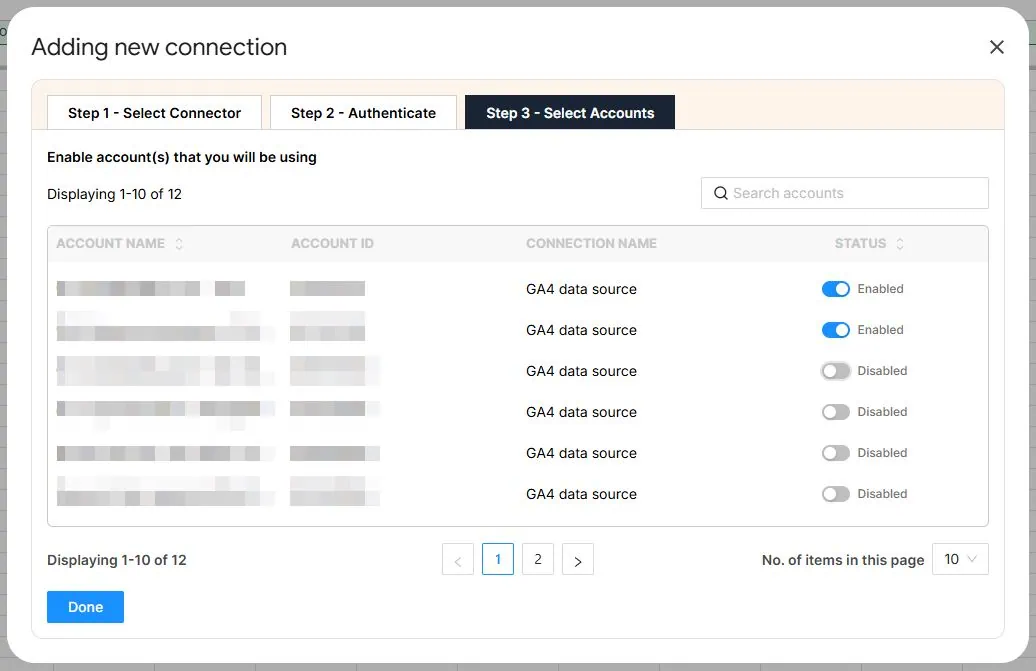
6 – Go through the login process until the tool instructs you to close the tab since the sign-in is successful.

7 – Select the GA4 accounts you want data from.
Import GA4 Data Query
This point in the process is importing data from the GA4 API to the spreadsheet.
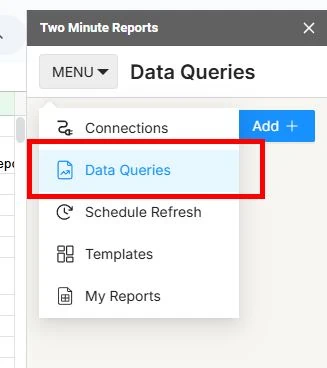
1 – Click on the burger icon. Then click on Data Queries.
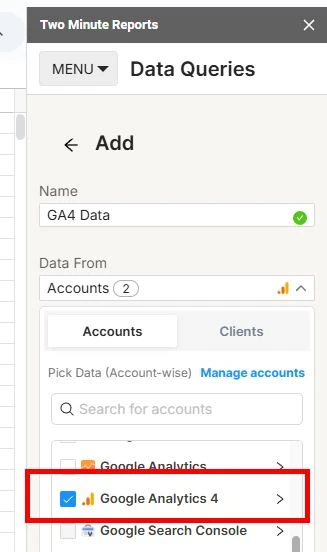
2 – Click on Add +.
3 – Name your data query. Then find the GA4 data source you imported earlier. Also select the GA4 account you data from.
Query:
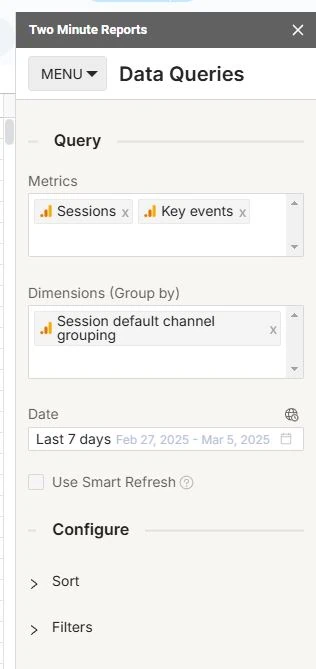
4 – Under Metrics, select the metrics you want to import. In this example, we use Sessions and Key events.
5 – Under Dimensions, select the dimensions you want to import. In this example, we use Session default channel grouping.
6 – Under Date, Select the date range to your use case. In this example, it’s the Last 7 days.
As for the Filters and other data options, you may leave them unticked or empty for now.
7 – Under Result, Save on Sheet is the location of the sheet where the data is imported to, so make you know what your tabs are named after. Add A1 under Cell in this example.
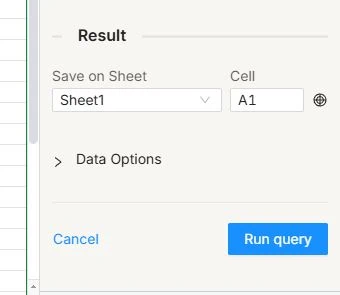
8 – Click on the Run query button.
Viola! You imported your GA4 data to Google Sheets much quicker! You can create reporting templates from here depending on your business needs.
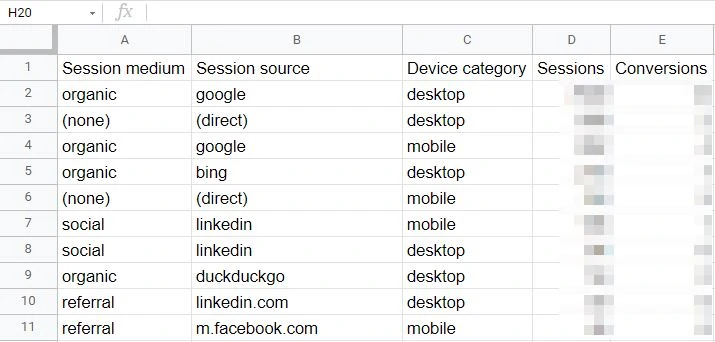
In this example, we imported data from GA4. The number of Sessions and Conversions are now within reach. You can adjust the parameters depending on your use cases like Device category.
Schedule GA4 Reports
Two Minute Reports has a scheduling function. This means the spreadsheet refreshes the acquired data from the API. Reports are automated even more.
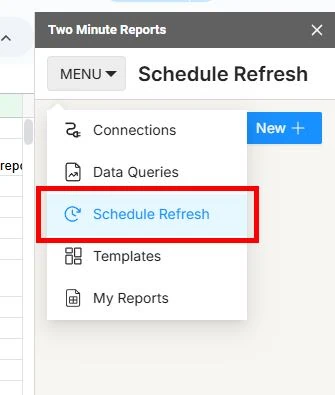
1 – Click on MENU. Then click on Schedule Refresh.
2 – Click on New +.
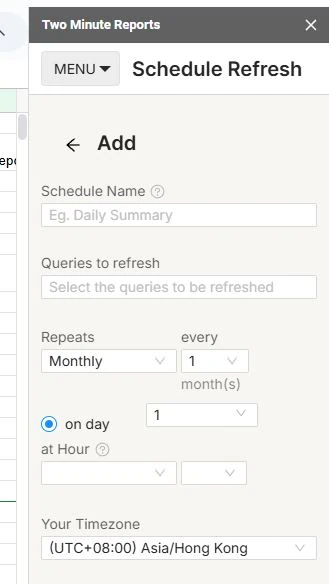
3 – Once inside, you can set the terms of the report schedule.
-Name
-Repeats: This is where you set how often the data refresh happens. Two Minute Reports can do hourly refreshes.
-Timezone
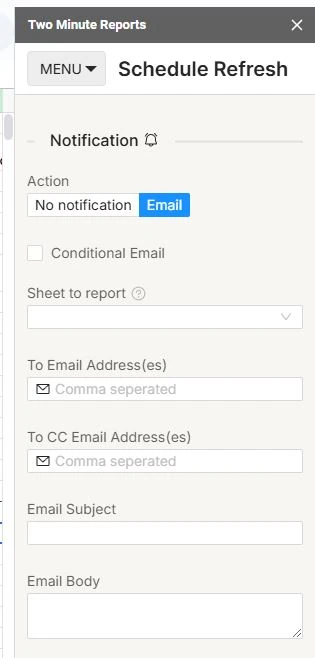
4 – You can also set the notification terms. Two Minute Reports can email you a PDF or Excel of the data. You can also decide to have the email contain the sheet content in the email body.
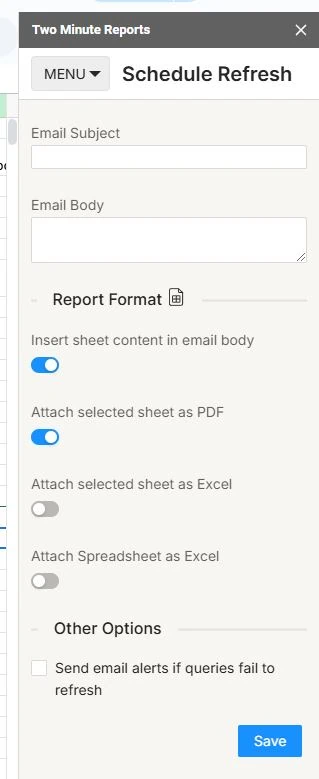
5 – Click on Save.
Scheduling helps when you need to report on overtime. No more copy and paste manual reports every day, or every week, or every month.
Option 3: Third-Party Integration Tool
You’ll use Make for this option. Make is a powerful integration platform that allows you to visualize, design, and automate your work in minutes. In other words, it lets apps talk to each other so that you can remove repetitive tasks.

Create a Make account and get started.
Getting Started
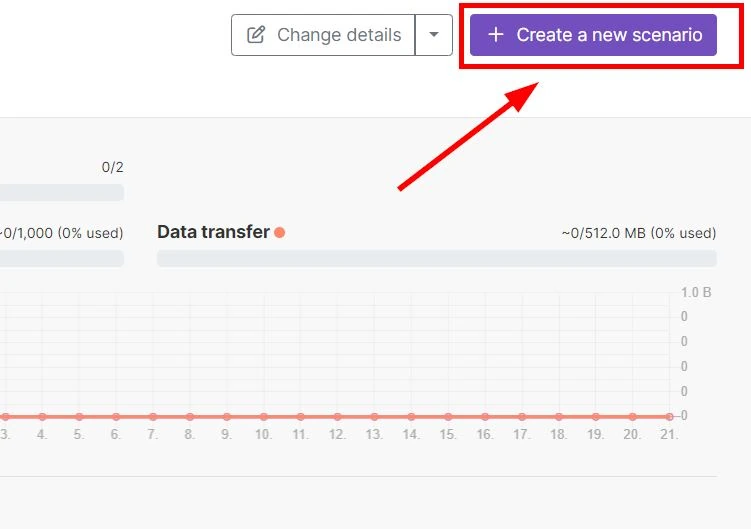
1 – Click on + Create a new scenario. This is where you start building the connection between tools.
2 – Once inside, click on the HUGE circle with a PLUS SYMBOL.

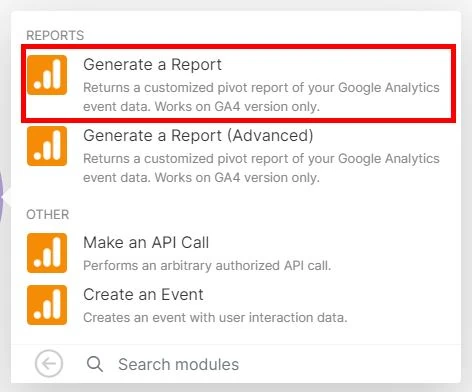
3 – Search for Mailchimp. Then select Generate a Report. Then select Create a connection.
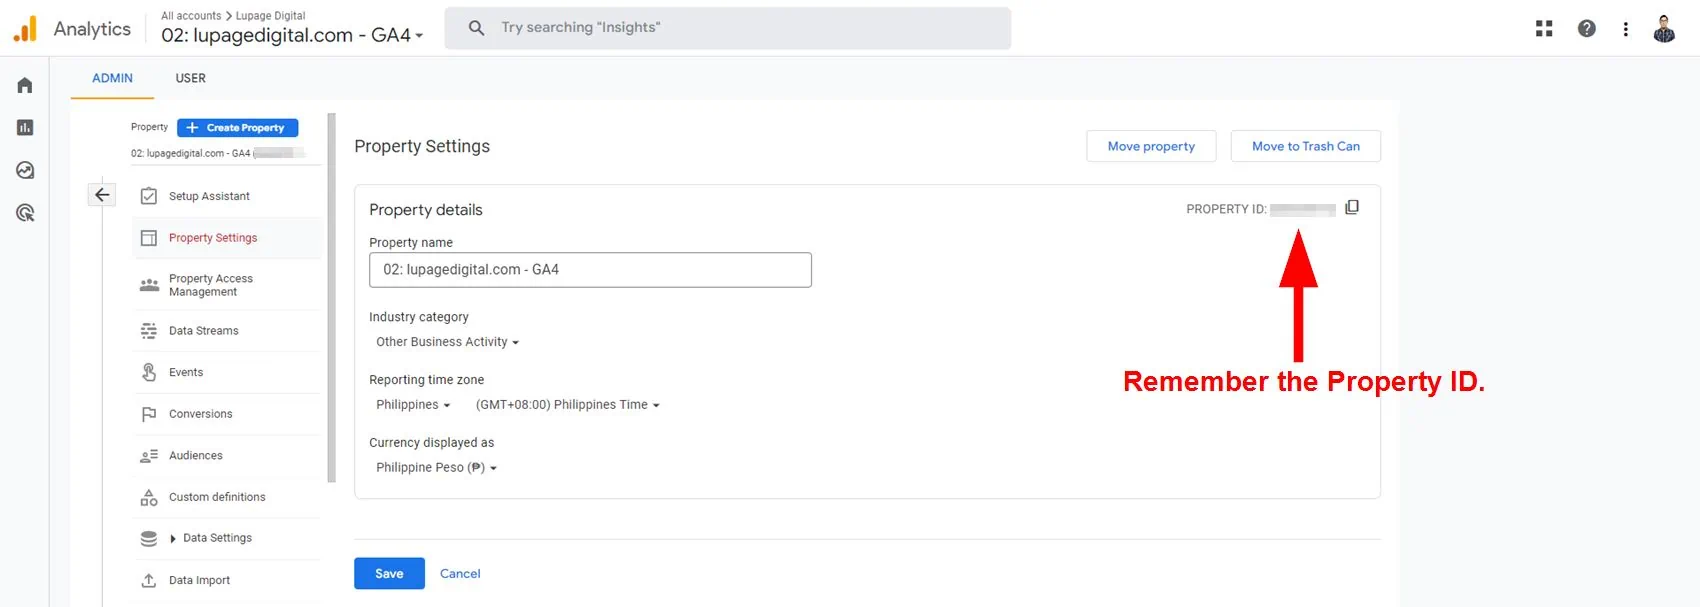
Take Note of Your GA4 Property ID
Before anything else, take note of your GA4 property ID. This is needed to integrate the scenarios in Make. Decide on your end which GA4 property you want to use.
Go to your GA4 account.
1 – Under ADMIN, click on Property Settings.
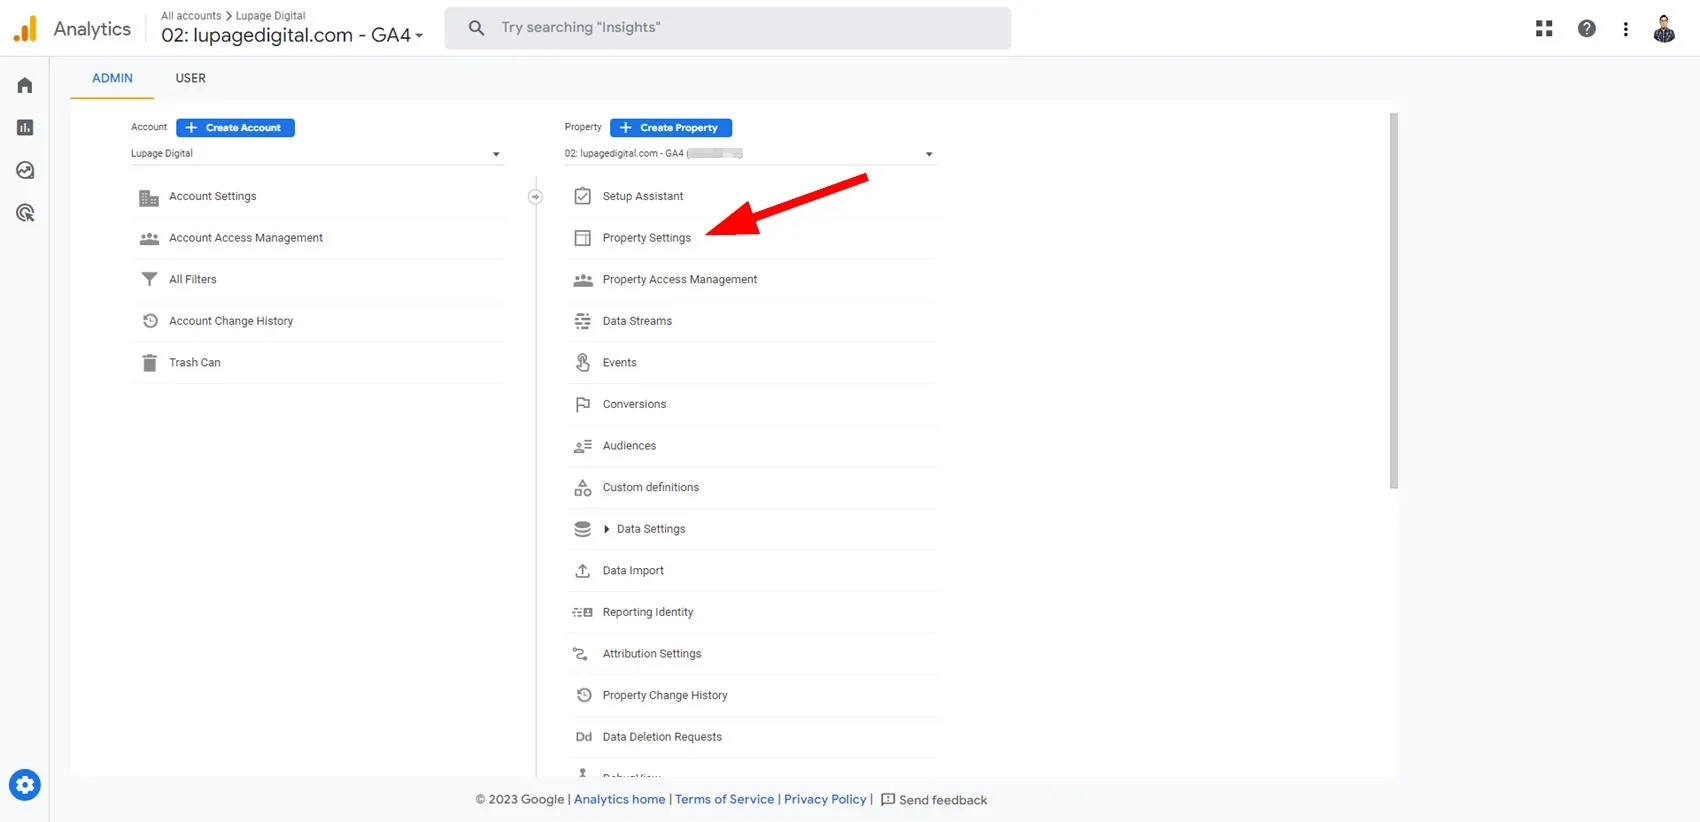
2 – Remember and take note of the property ID from the right side. The number is 9 digits. This is what you enter in Make.
Setting Up GA4 Connection
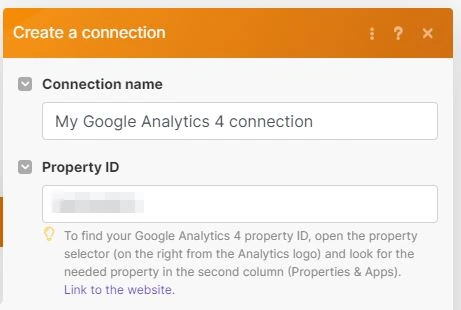
1 – Under Connection click on Create a connection.
2 – Under Connection name, name the connection. The name is arbitrary so it’s up to you. But I suggest writing a descriptive name for later use.
3 – Under Property ID, enter the GA4 property ID of your choice.
4 – Click on Save.
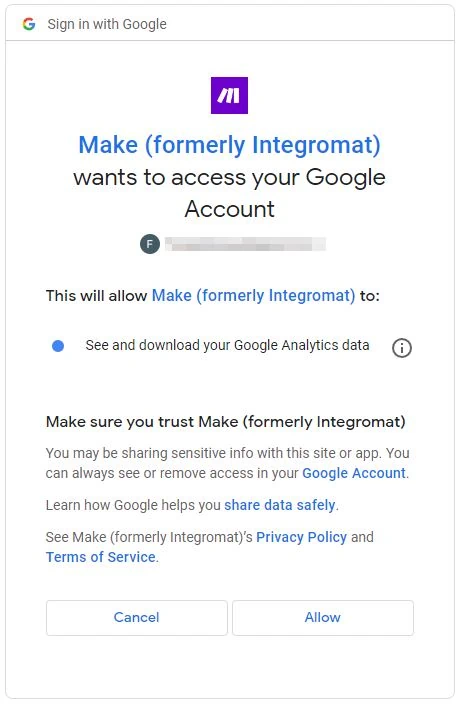
A pop-up window appears.
5 – Inside the pop-up window, sign-in to the Google or Gmail account to give Make access to your Google Analytics data.
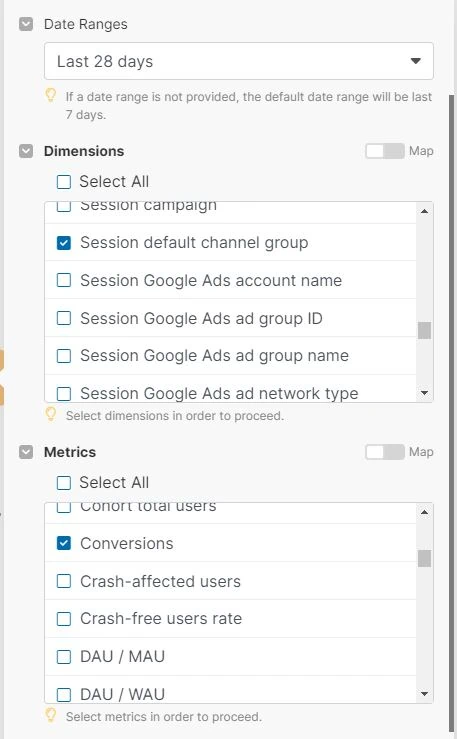
Back in Make, enter all necessary Dimensions and Metrics from GA4.
6 – Under Date Ranges, select the date range you need.
7 – Under Dimensions, select the data you need. Keep things simple and only get the important data.
Select the following for this example:
Session default channel group
Session source
8 – Under Metrics, select the data you need. Keep things simple and only get the important data.
Select the following for this example:
Sessions
Conversions
There are other advanced filters like Action attribution windows and Action breakdowns. For now, ignore these to proceed with the automation. You may go back to them later.
9 – Click on OK.
Done! At this point, you’re finished with the GA4 connection. Go back to the canvas and press right-click. Then select Add a module.
Setting Up Google Sheets Connection
Next is setting up the Google Sheets connection. But first, you need to go to Google Drive and create a new Google Sheets file.
1 – Go to your Google Drive workspace.
2 – Click on + New then create a new Google Sheets file.
3 – Name the Google Sheets file. The name is arbitrary so it’s up to you. But I suggest writing a descriptive name for later use.
4 – Name the tab or sheet on the bottom. The name is arbitrary so it’s up to you. But I suggest writing a descriptive name for later use.
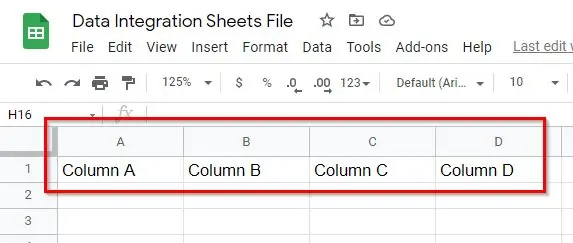
5 – Name the headers. It’s helpful to map out the correct data point in the integration process later.
Column A
Column B
Column C
Column D
The first steps are done! Go back to Make.
1 – Press right-click. Click on + Add a module. Or you can double-click then click on the HUGE circle with a PLUS SYMBOL.
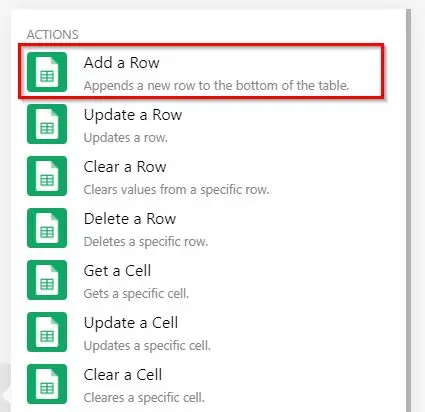
2 – Search for Google Sheets. Then select Add a Row.
3 – Under Connection, click on Add or Create a connection.
4 – Name the connection. The name is arbitrary so it’s up to you. But I suggest writing a descriptive name for later use.
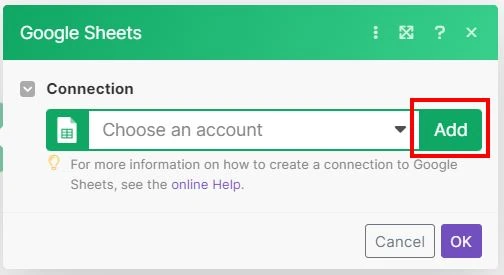
5 – Click on Continue or Sign-In. A pop-up window appears.
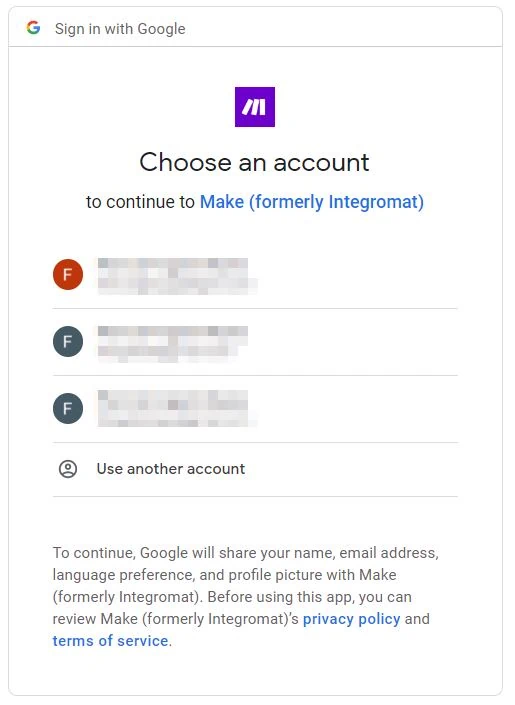
6 – Inside the pop-up window, select the Gmail account that stores the Google Sheets file.
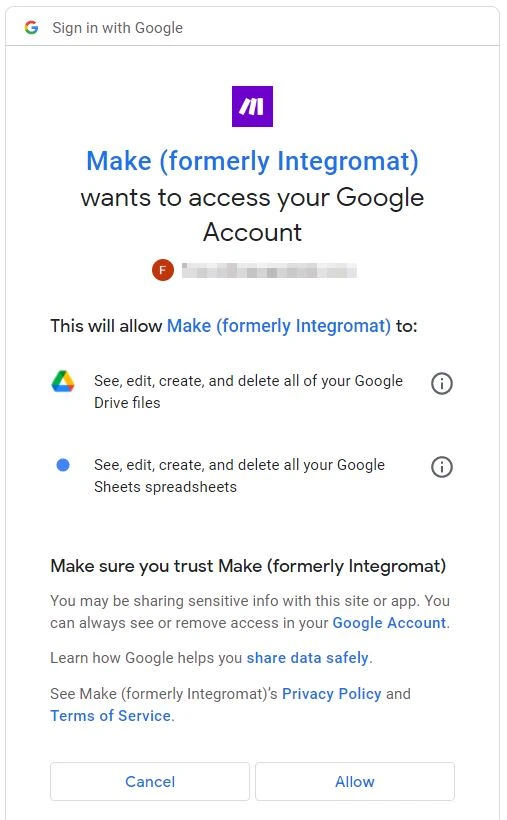
7 – Click on Allow. Make asks permission to access your Google account. This is standard procedure. The window closes after clicking it.
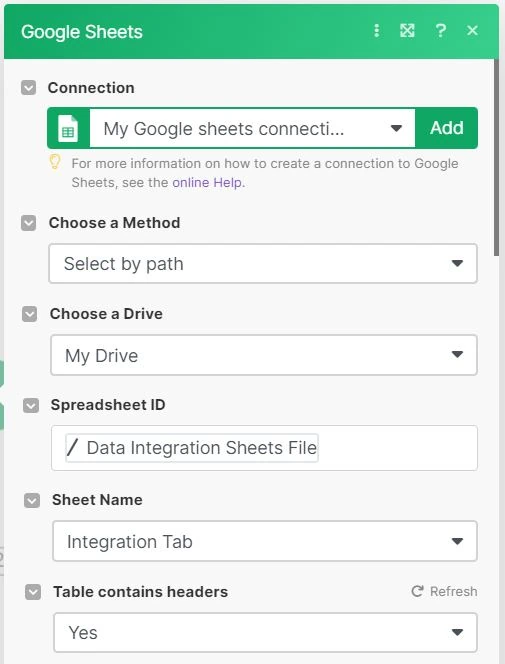
Back in Make you add the additional parameters.
8 – Under Choose a Method, choose Select by path.
9 – Under Choose a Drive, select My Drive. The spreadsheet you created earlier is likely located here.
10 – Under Spreadsheet ID, select the Google Sheets file you created earlier. Find the name you gave it.
11 – Under Sheet Name, select the Google Sheets tab from earlier. Find the name you gave it.
12 – Under Table contains headers, select Yes.
After which, the Values are created.
13 – Under Values is where it gets tricky. The headings from the Google Sheets file are the parameters where you decide the values. Once you click on the field, you’re presented with different parameters. Don’t be overwhelmed. Read the context of the parameters to know which one is mapped to which.
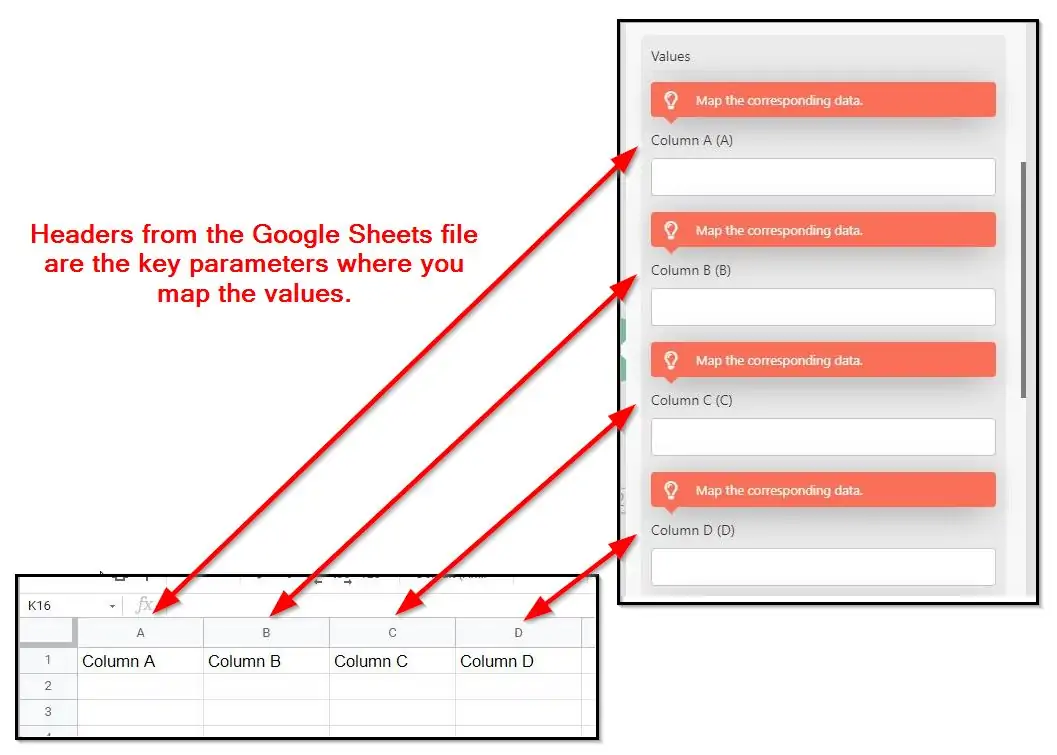
Under (A), select Session default channel group.
Under (B), select Session source.
Under (C), select Sessions.
Under (D), select Conversions.
The parameters that appear here are from the connection you added earlier. Other parameters are also available. Make sure to add an extra column and name it on the Google Sheets spreadsheet so on and so forth.
The parameters that appear here are from the connection you added earlier. Other parameters are also available. Make sure to add an extra column and name it on the Google Sheets spreadsheet so on and so forth.
14 – Click on Ok. Now it’s time to run and process the integration.
15 – Click on Run once with a play button icon.

A spinning wheel and a Log on the bottom right appear. Wait for the integration to finish. How long the integration takes depends on the Maximum number of results you select. It’s finished when a) green checkmarks appear, and when b) The scenario run was completed appears in the Log.

Go to your Google Sheets file and you now see the campaign data successfully exported from GA4. Viola! Congratulations you imported GA4 data to Google Sheets with complete information! You may also add other parameters or fields if you need them.
Schedule Automation and Reports
Make can schedule the automation based on cycles. The schedule is up to you.
1 – On the screen, click on the Scheduling button and turn it on.
2 – Under Run scenario, select the schedule you need. What you select on this parameter dictates the next ones.
If you select At regular intervals, you need to select the minutes that Make processes the automation.
If you select Once, you need to select the date.
If you select Every day, you need to select the time.
If you select Days of the week or Days of the week, you need to select the days.
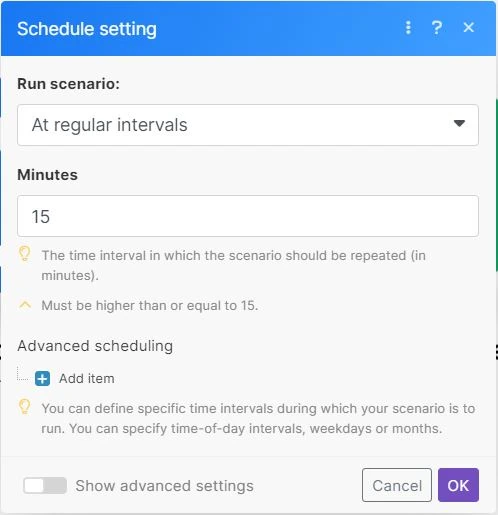
3 – Click on Ok. Ignore any advanced settings for now.
(Legacy) Import Universal Analytics to Google Sheets
Google has discontinued Universal Analytics in favor of Google Analytics 4. The guide below is for legacy purposes on how to import Universal Analytics to Google Sheets.
Using the Official Google Sheets Extension (Free)
This option uses the legacy Google Analytics Spreadsheet extension.
Installing The Google Sheets Extension
1 – Go to your Google Drive workspace.
2 – Click on + New then create a new Google Sheets file. Name your Google Sheets as well.
3 – At the top of your file, click on Extensions. Then click on Add-ons. Then click on Get add-ons.
4 – Search for the Google Analytics sheets extension. Then install it.
Set Up Google Analytics Data Source
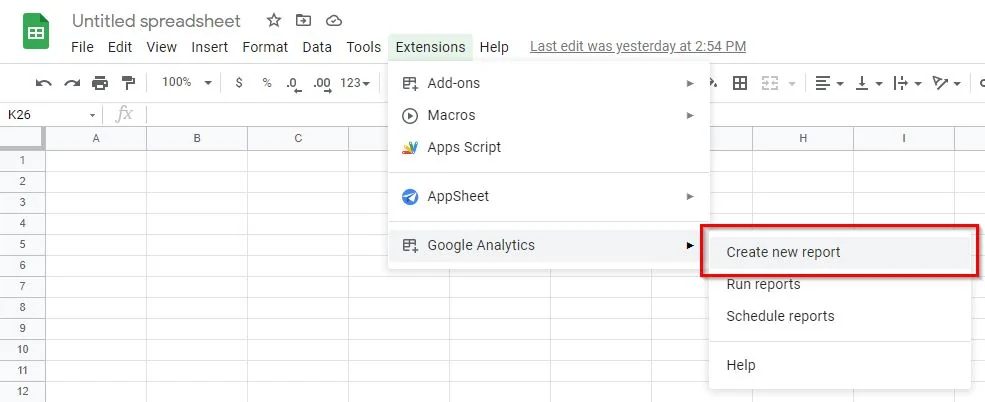
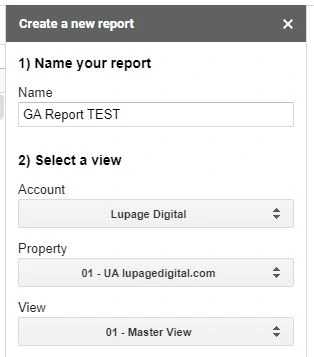
1 – Launch the add-on. Click on Extensions. Then click on Google Analytics. Then click on Create new report. A navigation pane on the right side appears.
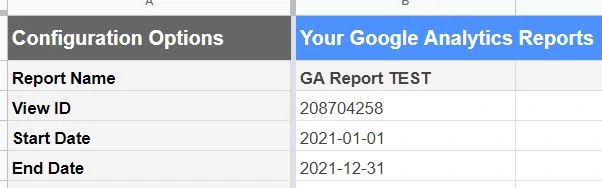
2 – Name your report.
3 – Select the Google Analytics Account, Property and View where you want to get data from.
Note: Make sure you’re familiar with the names of your Google Analytics setup.
4 – Under Metrics, select the metrics you want to import. In this example, add Sessions.
5 – Under Dimensions, select the dimensions you want to import. In this example, add Source and Medium.
You may leave Segments empty for now.
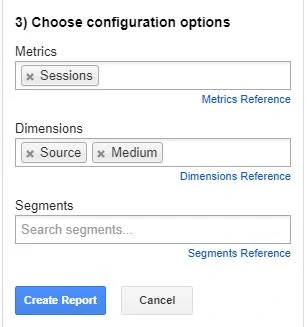
5 – Click on Create Report.
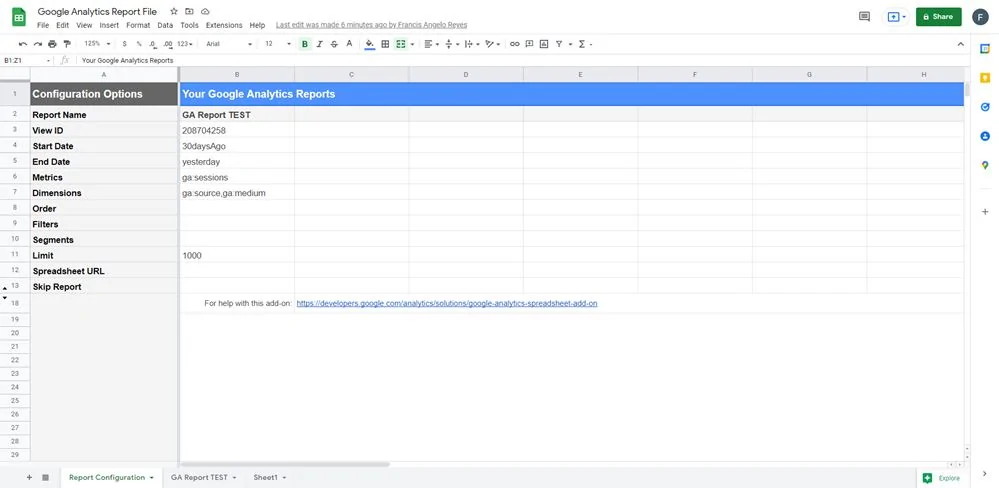
Note: This doesn’t create the actual report just yet. This section only syncs up the data sources. The results looks like this:
Running Google Analytics Reports
This allows the API (application programming interface) to get data from Google Analytics without errors.
1 – At the top of your file, click on Extensions. Then click on Google Analytics, then click on Run reports.
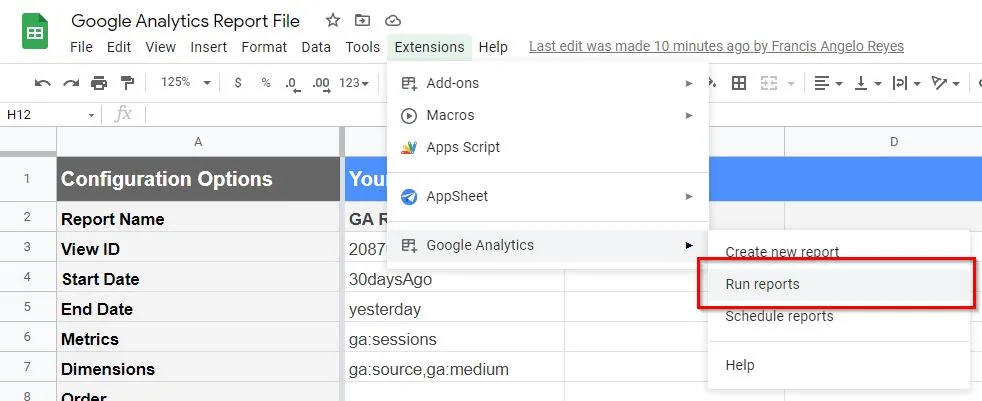
2 – If setup is correct, the API runs the query. You get a success notification. Click on OK.

A new Google Sheets tab is created, and that contains the report.
Running Other Google Analytics Reports
This part becomes tricky since you need to replace some of the fields based on your use cases.
1 – Go back to Report Configuration sheets tab. This is where you replace some of the fields.
2 – For Start Date, change it based on your use case in YYYY-MM-DD format. In this example, use 2021-01-01 for January 01, 2021.
3 – For End Date, same thing. Change it based on your use case in YYYY-MM-DD format. In this example, use 2021-12-31 for December 31, 2021.
For Metrics and Dimensions, you need to consult and understand the API documentation of Google Analytics.
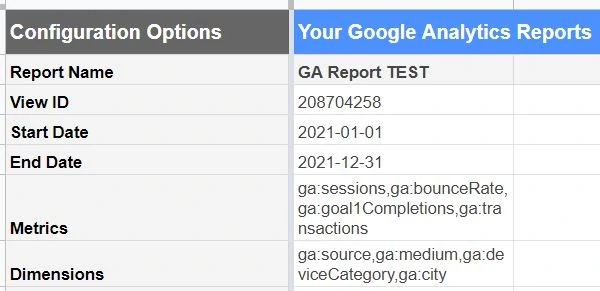
4 – Under Metrics, you may add Bounce rate, Goal conversions, or eCommerce transactions. These parameters are separated by comma.
ga:sessionsga:bounceRatega:goal1Completionsga:transactions
5 – Under Dimensions, you may add Device category and city. These parameters are separated by comma.
ga:sourcega:mediumga:deviceCategoryga:city
You may leave the Order and other fields untouched for now.
6 – At the top of your file, click on Extensions. Then click on Google Analytics, then click on Run reports.
7 – If setup is correct, the API runs the query. You get a success notification. Click on OK.
8 – Go back to the Google Sheets tab that contains the report. The sheet is now updated with new data points.
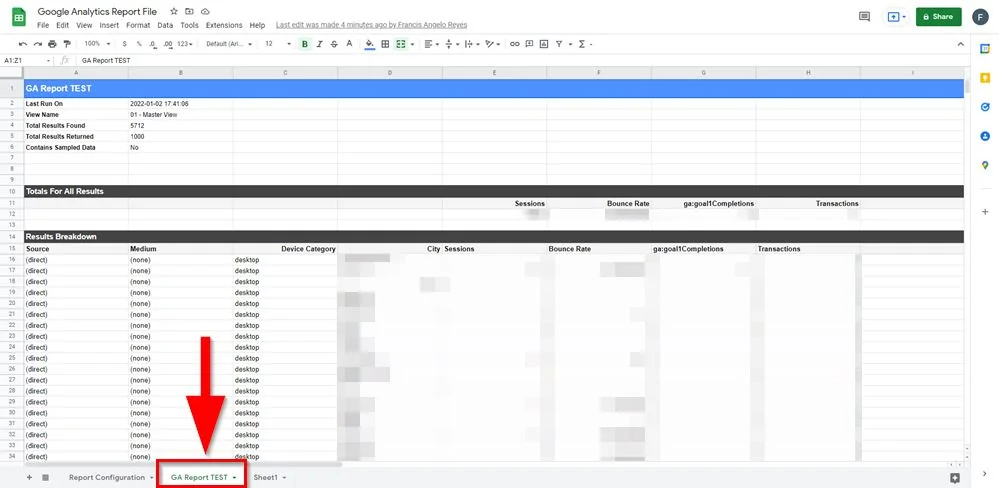
Viola! You imported your Google Analytics data to Google Sheets!
Schedule Google Analytics Reports
Google Analytics sheets extension has a scheduling function. This means the spreadsheet refreshes the acquired data from the API.
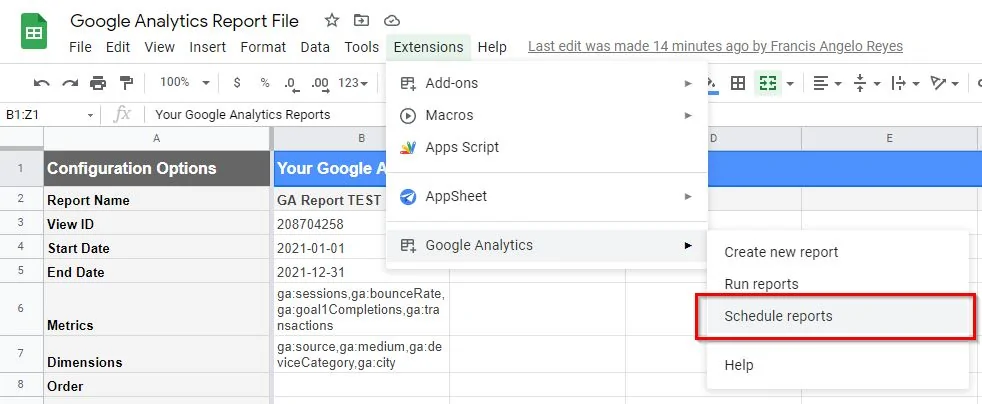
1 – At the top of your file, click on Extensions. Then click on Google Analytics, then click on Schedule reports.
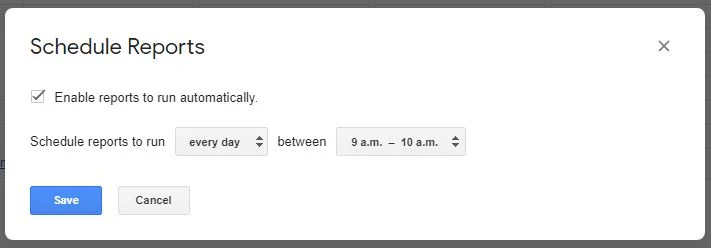
2 – Tick Enable reports to run automatically.
3 – Select the schedule for your use cases. You may select every hour, every day, every week, or every month.
Scheduling helps when you need to report on events and engagements in the future. No more copy and paste every day, or every week, or every month.
Why You Should Connect GA4 with Google Sheets
Most digital analysts might ask why bother importing Google Analytics 4 to tools like Sheets. For starters, the GA4 user interface is limited and sometimes clunky. Some features from Universal Analytics haven’t been transferred to GA4 yet. That said, there are few reasons why it’s better to use an external tool.
Create More Complex Reports
An advantage of importing to Sheets is the ability to create custom reports. Google Sheets offers a wide range of formatting options. This can help analyze and visualize data in a more meaningful way. Users can also customize their reports by adding formulas and functions, allowing for more detailed analysis and insights.
Importing to Google Sheets offers a seamless data integration with other tools such as Looker Studio. This allows users to combine data from other sources and create comprehensive reports further enhancing processes.
Achieve Data Accessibility
Exporting Google Analytics 4 (GA4) data to Google Sheets and engaging in Google Analytics consultation are interconnected processes that enhance the analysis and utilization of web analytics data. Exporting GA4 data to Google Sheets allows stakeholders to access their analytics data in a familiar, easy-to-use format. This data could include metrics like user counts and other data sources like Facebook Ads.
Allows Team Collaboration
As an extension of creating custom reports, another benefits is the ability to enhance team collaboration. With Google Sheets, team members can access and edit a GA4 report together. It provides real-time updates and allows for more efficient teamwork. This is especially helpful for teams working remotely or across different time zones.
During consultations, having GA4 data in Sheets allows for easier exploration of specific topics and metrics in real-time, enhancing the interactive nature of discussions between consultants and stakeholders.
Create Data Backups
Connecting GA4 to Sheets allows users to create data backups. This is an important component as it allows for data preservation in case of any technical issues (like SEO migrations). It also prevents sampling and threshold issues unlike using the GA4 user interface. With regular backups on Google Sheets (and by extension in Google Drive), marketers can access their data easily.
Without breaking the bank, Google Sheets allows companies to create a ‘mini-database’. Importing GA4 to Google Sheets offers a free solution as it eliminates the need for an expensive database. Google Sheets provides a budget-friendly option for managing GA4 data.
More articles on automation:
Import Facebook Page Insights to Google Sheets
Import LinkedIn Page post data to Google Sheets
Import LinkedIn Ads API data to Google Sheets
Import Search Console Data to Google Sheets
Import WooCommerce data to Google Sheets
Import Facebook Ads data to Google Sheets
Import Google Ads data to Google Sheets
Import Mailchimp data To Google Sheets
Import Shopify data to Google Sheets
Import TikTok ads to Google Sheets
Import GA4 data to Google Sheets
Import ChatGPT to Google Sheets
Import JSON to Google Sheets
Export Gmail to Google Sheets
Conclusion: Create GA4 Reports Quicker
This is one of the options to connect data from GA4 to Google Sheets. These are the current methods (more in the future) to do API integrations between tools. These tools cost money, but the benefits outweigh more.
Avoid import and export spreadsheet hell. Maintain everything step-by-step in Google Sheets with tools if needed. Stop wasting time on repetitive tasks and start focusing on important things that impact the business. Hire a web analyst to help you.