
Summary
– You can connect Facebook Ads data to Google Sheets using different methods.
– By using third party tools, you can also use features to help with data import/export.
– The general flow is 1) connect the data source > 2) choose metrics > 3) connect to your spreadsheet.
Facebook advertising is an important channels in the digital marketing industry. Like other marketing channels, it needs reporting. However, Facebook reporting is tough as the Facebook Ads API (application programming interface) is hard to understand to start with and the interface is confusing to use.
Google Ads is better with reporting since it’s within the Google ecosystem. So this means that the integration is easier. And you can start analyzing the data quickly. Facebook doesn’t have that luxury.
You CAN import Facebook Ads data to Google Sheets. You do copy and paste until your eyes and fingers can’t take the mundane task anymore. That’s manual reporting and it’s an unbearable nightmare. Who wants to do that?! There are better ways to automate this task and save time.
How to Import Facebook Ads Data to Google Sheets
This article shows two options on how to import Facebook ads data to Google Sheets. Option 1 is using a Google Sheets extension. Option 2 is using a third-party integration tool. No required coding skills. Note that the data below is for paid advertising and not from organic Facebook pages.
*You can also import and connect Facebook Ads data to Looker Studio.
Option 1: Google Sheets Extension
You’ll use Two Minute Reports for this option. Two Minute Reports imports data from the Facebook API directly to Google Sheets in minutes. Create an account and get started. Another Google Sheets extension to use is Supermetrics.
Installing The Google Sheets Extension
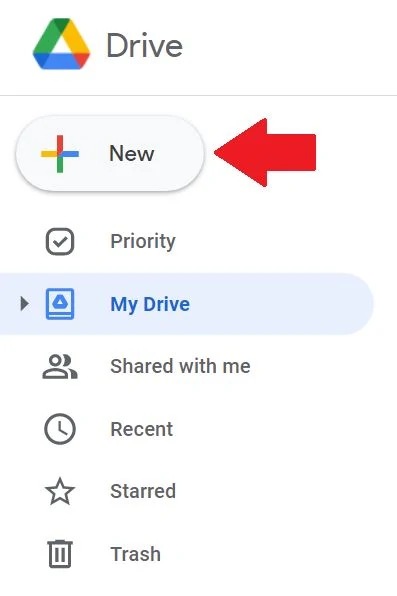
1 – Go to your Google Drive workspace.
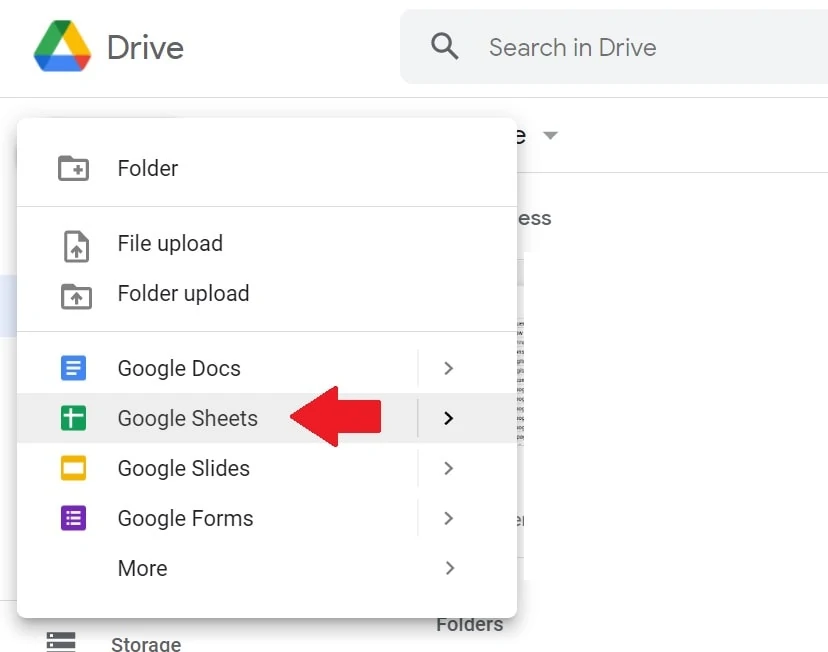
2 – Click + New then create a new Google Sheets file.
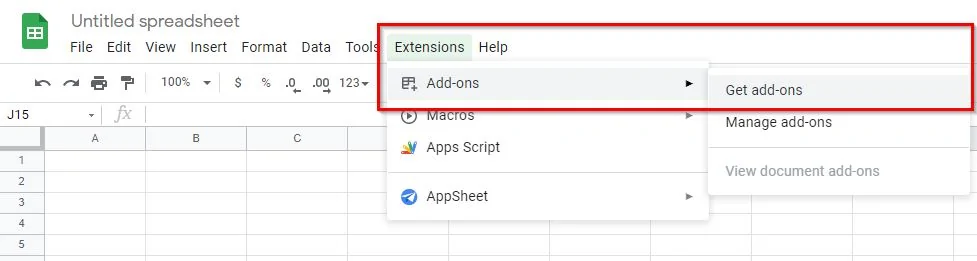
3 – At the top of your file, click on Extensions. Then click on Add-ons. Then click on Get add-ons.
4 – Search for Two Minute Reports. Then install it.
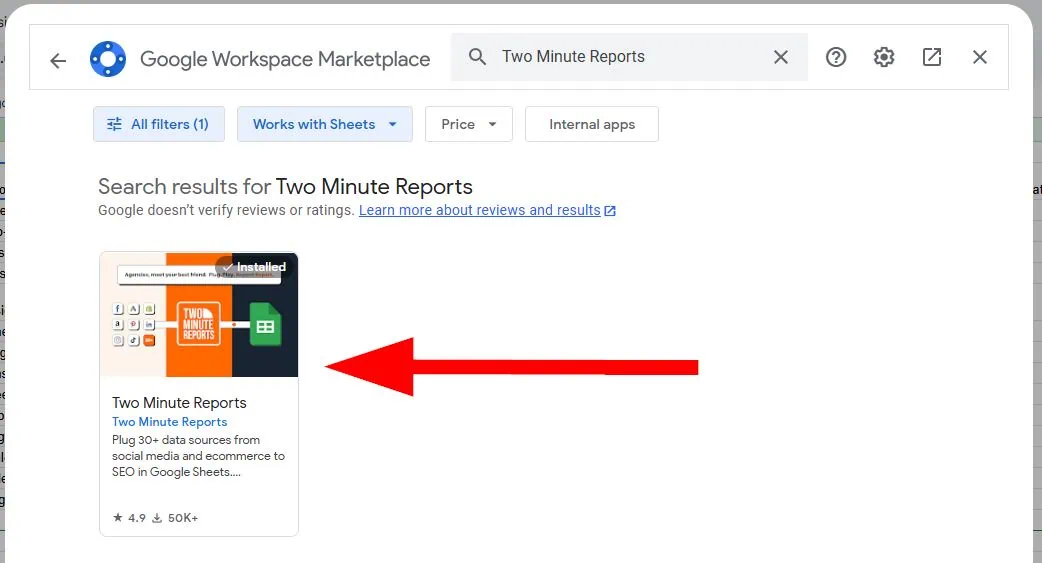
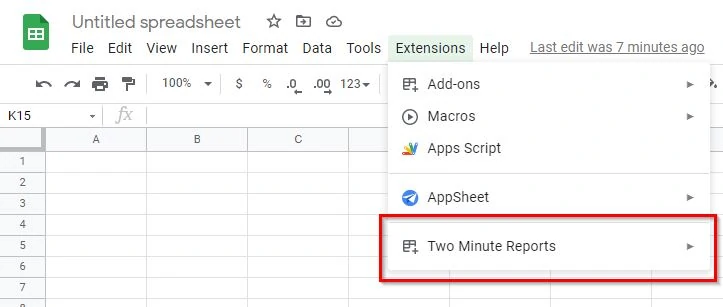
5 – You now have the extension installed on your Google Sheets file.
Import Facebook Ads Data Source
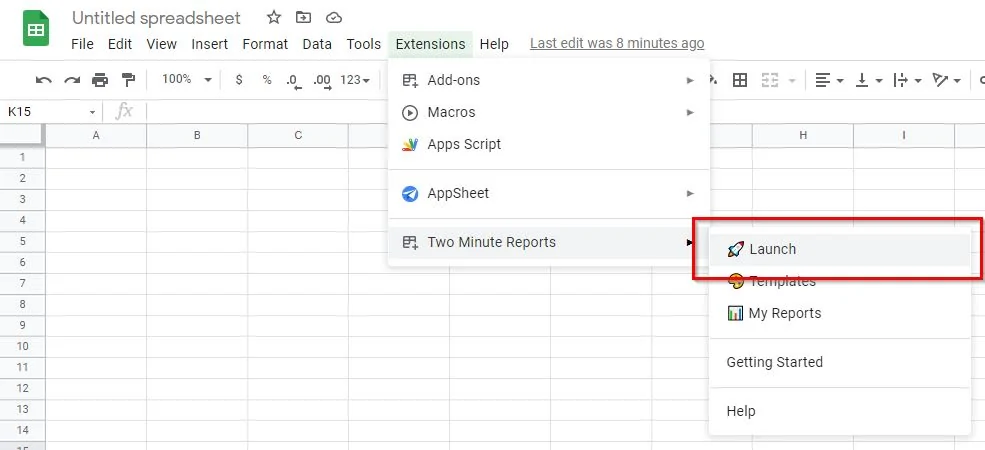
1 – Launch the extension. A navigation pane on the right side appears.
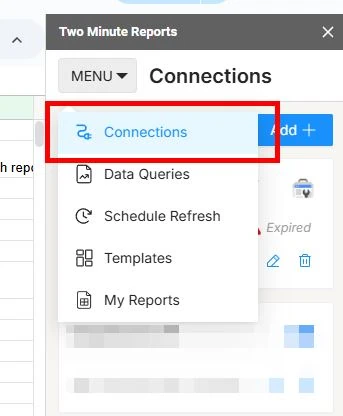
2 – Click on MENU then click on Connections then clickc on Add +.
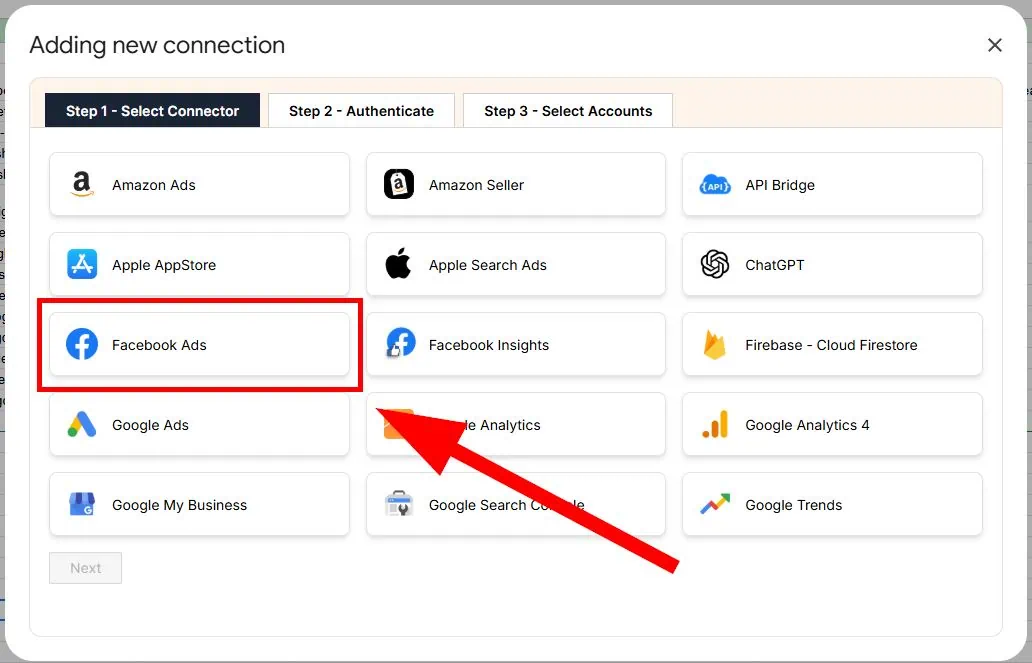
3 – Select Facebook Ads.
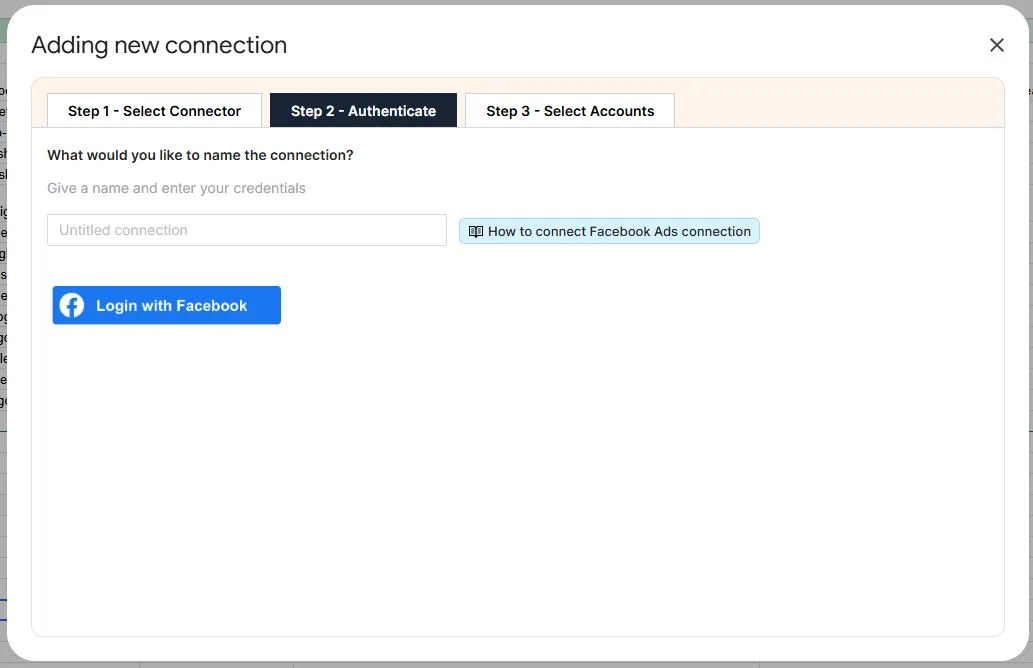
4 – Log in to your Facebook account and go through the authentication.
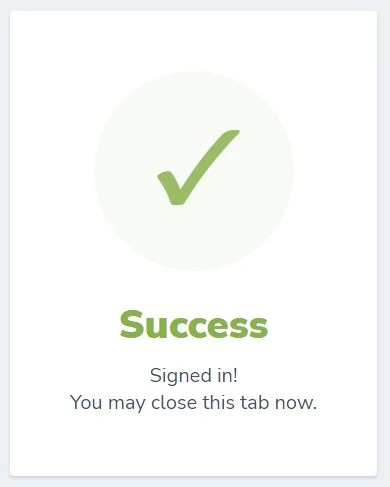
5 – Link your Facebook account to the tool. Go through the process until the tool instructs you to close the tab since the sign-in is successful.
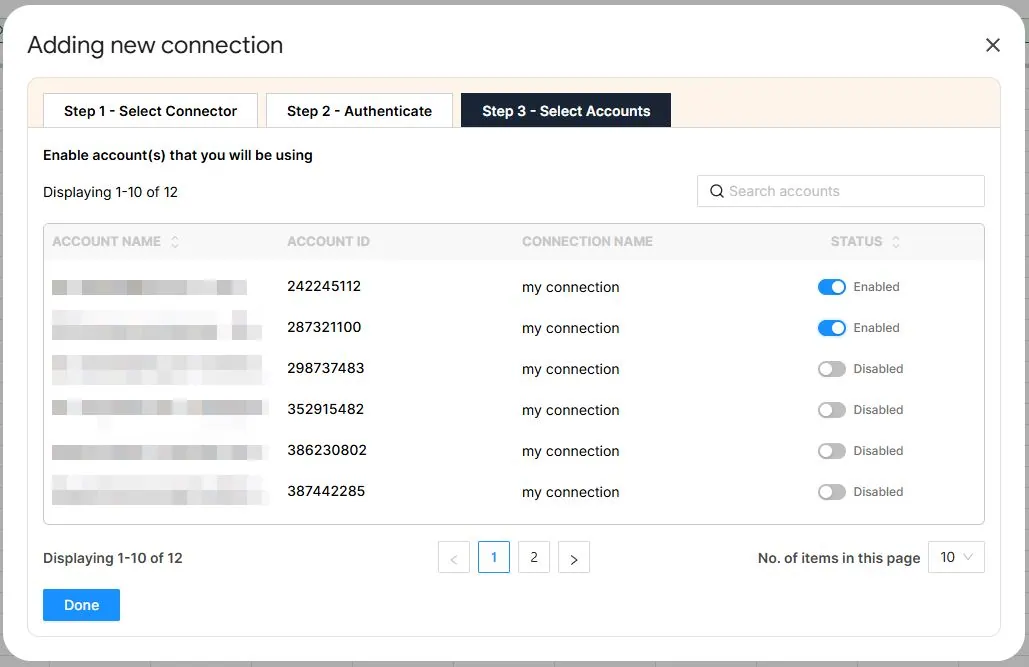
6 – Select the account or campaign from your Facebook Ads Manager.
Import Facebook Ads Data Query
This point in the process is importing data from the Facebook Ads API to the spreadsheet.
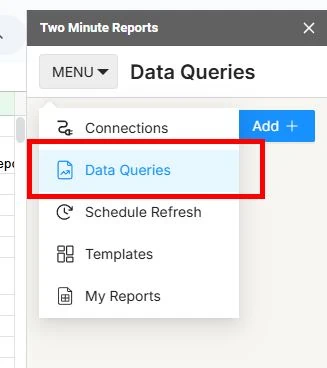
1 – Click on MENU. Then click on Data Queries. And click on Add +.
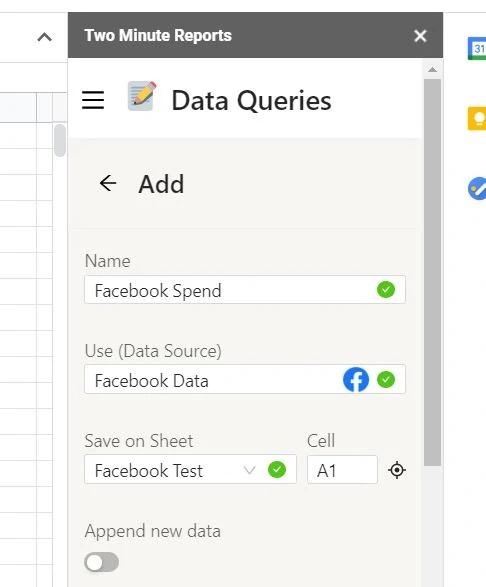
2 – Name your data query. Find the Facebook data source you imported earlier.
3 – Save on Sheet is the location of the sheet where the data is imported to. Add A1 under Cell.
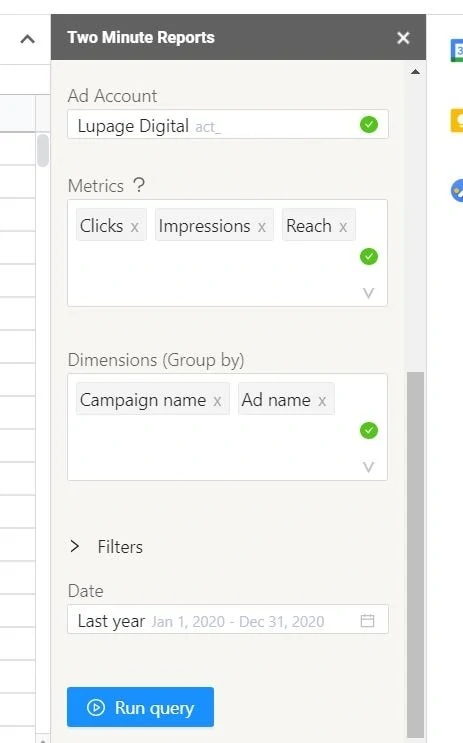
4 – Under Query, select the Facebook Ad Account you want to get data from. *See further down this blog post to learn how to give permissions on Facebook.
5 – Select the Metrics you want to import (Clicks, Reach, Impressions, Conversions, etc).
6 – Select the Dimensions you want to import (Campaign name, Ad name, etc).
7 – Select the date range.
8 – You may select additional Filters and Sort options. You may ignore them blank for now.
9 – Click on Run query.
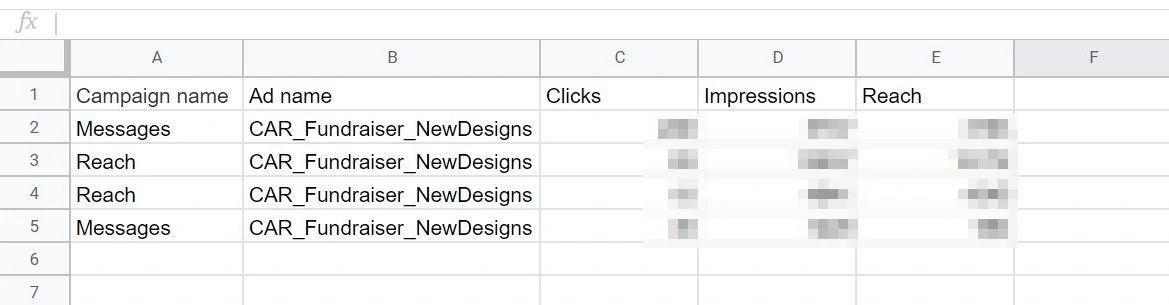
Viola! You imported your Facebook ads data to Google Sheets hassle-free. You can create reporting templates from here depending on your business needs.
Two Minute Reports can import all the metrics and dimensions from the Facebook API. As a rule of thumb, know what you need to report on and be knowledgeable of Facebook metrics.
Schedule Facebook Ads Reports
Two Minute Reports has a scheduling function. This means the spreadsheet refreshes the acquired data from the API. Reports are automated even more.
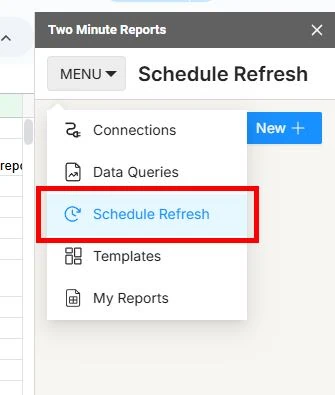
1 – Click on MENU. Then click on Schedule Refresh.
2 – Click on New +.
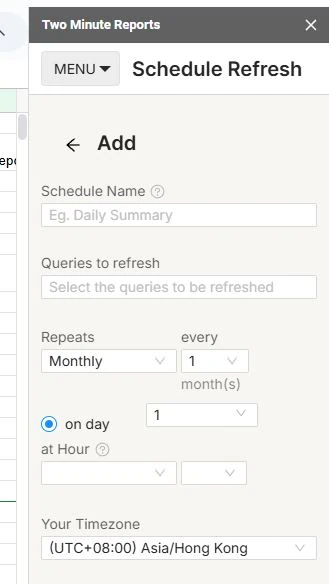
3 – Once inside, you can set the terms of the report schedule.
-Name
-Repeats: This is where you set how often the data refresh happens. Two Minute Reports can do hourly refreshes.
-Timezone
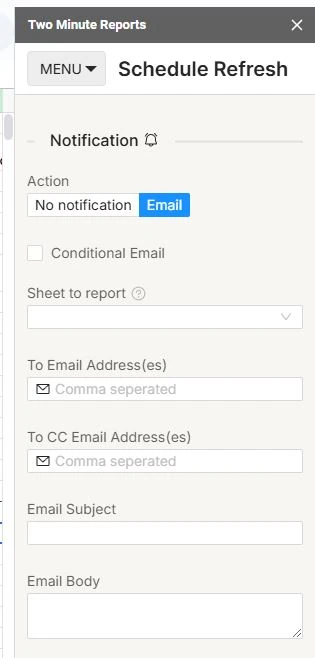
4 – You can also set the notification terms. Two Minute Reports can email you a PDF or Excel of the data. You can also decide to have the email contain the sheet content in the email body.
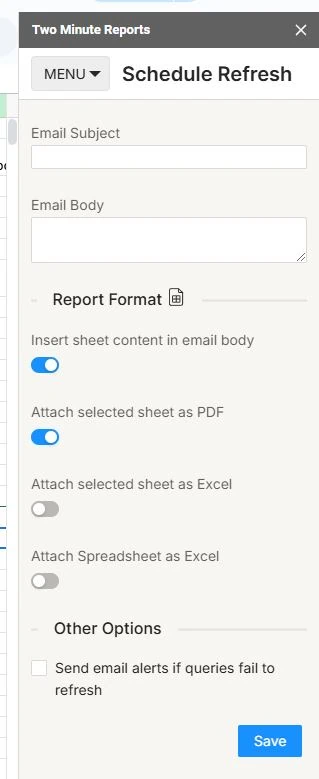
5 – Click on Save.
Scheduling helps when you need to report on overtime. No more copy and paste manual reports every day, or every week, or every month.
Option 2: Third-Party Integration Tool
You’ll use Make for this option. Make is a powerful integration platform that allows you to visualize, design, and automate your work in minutes. In other words, it lets apps talk to each other so that you can remove repetitive tasks.

Create a Make account and get started.
Getting Started
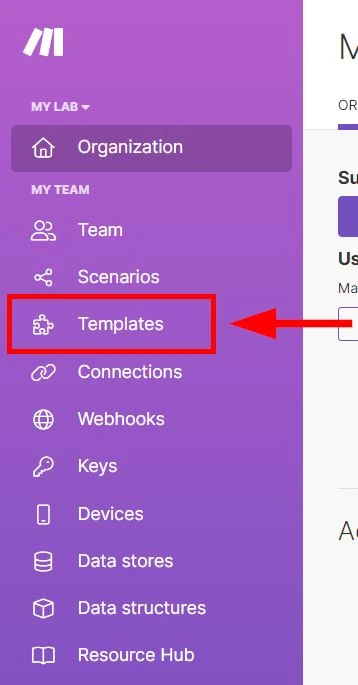
1 – Click on Templates. The tool already has a template since this scenario is a standard case.
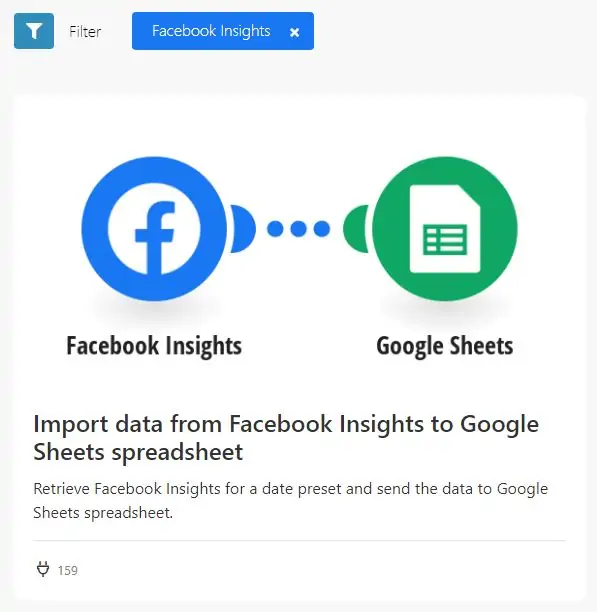
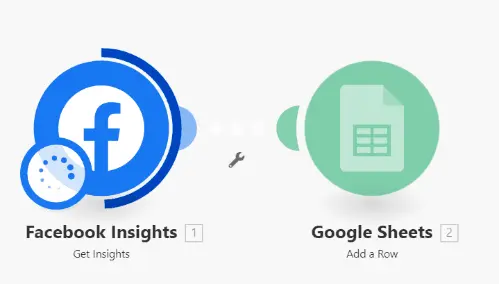
2 – Search and click on the Facebook Insights Google Sheets template.
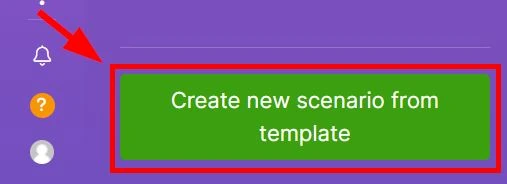
3 – Click on the Create new scenario from template button from the lower left of the page.
Setting Up Facebook Insights Connection
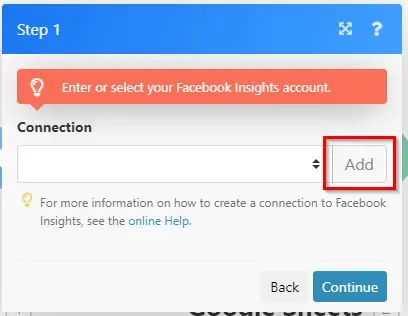
First is setting up the Facebook Insights connection.
1 – Under Connection click on Add.
2 – Under Connection name, name the connection. The name is arbitrary so it’s up to you. But I suggest writing a descriptive name for later use.
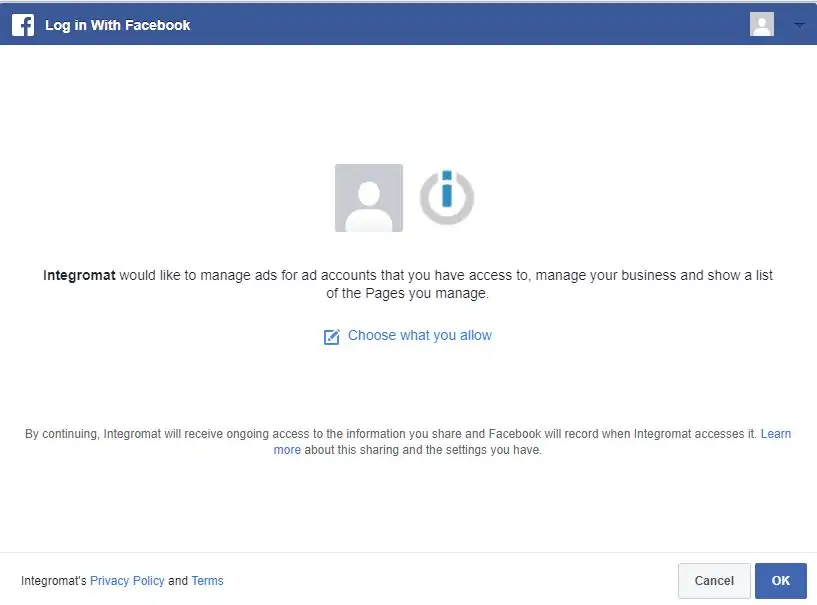
3 – Click on Continue. A pop-up window appears.
4 – Inside the pop-up window, select the Facebook account you want to select.
5 – Click on OK or Continue.
Back in Make is where you enter the data information from Facebook Insights.
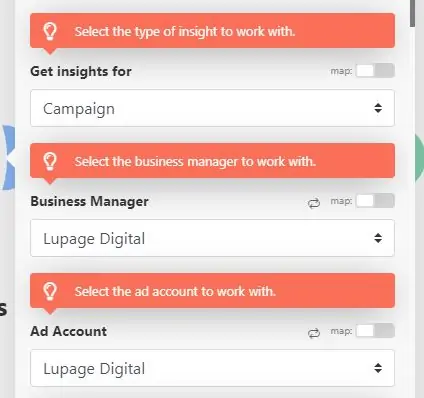
7 – Under Get insights for, select Campaign.
8 – Under Business Manager and Ad Account, select the account or business manager that has the campaign. Note that yours is different so you need to know which one.
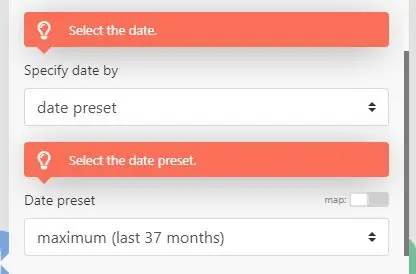
9 – Under Specify date by, select date preset. This allows easier setting of dates.
10 – Under Date preset, select the appropriate date. In this example, it’s maximum (last 37 months). Ignore Time increment for now.
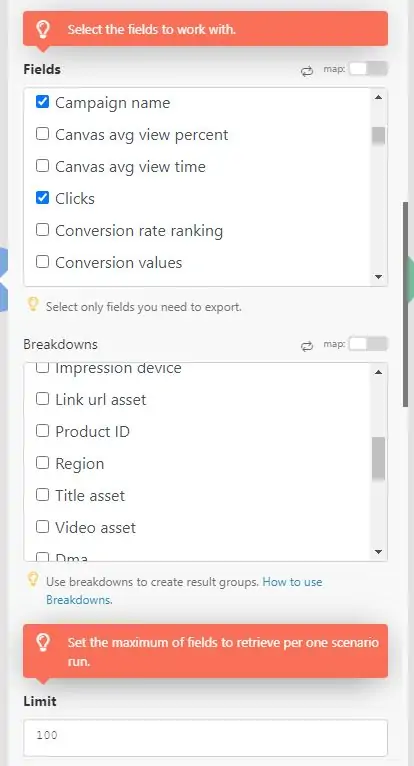
11 – Under Fields, select the data you need. Keep things simple and only get the important data.
Select the following:
Campaign name
Clicks
Impressions
Reach
There are additional Breakdowns. Ignore them for now to proceed. Ask your Facebook marketer for guidance.
12 – Under Limit, enter 100. Though it varies depending on use cases.
There are other advanced filters like Action attribution windows and Action breakdowns. For now, ignore these to proceed with the automation. You may go back to them later.
13 – Click on Continue.
Done! At this point, you’re finished with the Facebook connection side. The tool prompts you if there are missing values in the fields.
Setting Up Google Sheets Connection
Next is setting up the Google Sheets connection. But first, you need to go to Google Drive and create a new Google Sheets file.
1 – Go to your Google Drive workspace.
2 – Click on + New then create a new Google Sheets file.
3 – Name the Google Sheets file. The name is arbitrary so it’s up to you. But I suggest writing a descriptive name for later use.
4 – Name the tab or sheet on the bottom. The name is arbitrary so it’s up to you. But I suggest writing a descriptive name for later use.
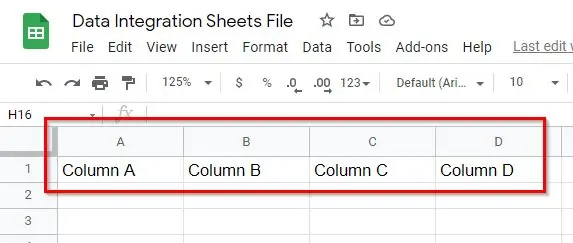
5 – Name the headers. It’s helpful to map out the correct data point in the integration process later.
Column A
Column B
Column C
Column D
The first steps are done! Go back to Make.
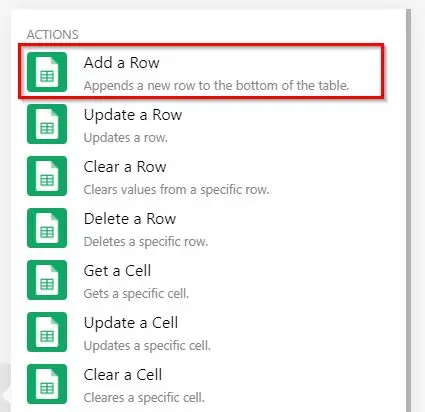
1 – Press right-click. Click on + Add a module. Or you can double-click then click on the HUGE circle with a PLUS SYMBOL.
2 – Search for Google Sheets. Then select Add a Row.
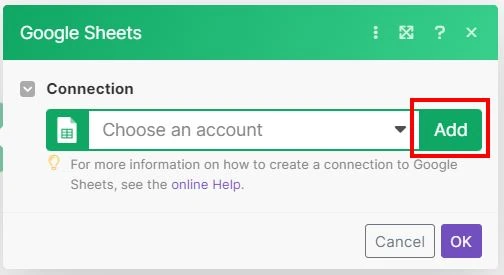
3 – Under Connection, click on Add or Create a connection.
4 – Name the connection. The name is arbitrary so it’s up to you. But I suggest writing a descriptive name for later use.
5 – Click on Continue or Sign-In. A pop-up window appears.
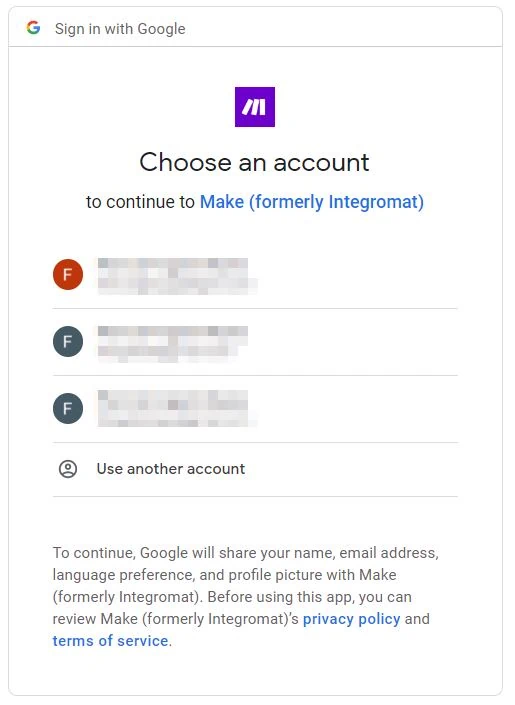
6 – Inside the pop-up window, select the Gmail account that stores the Google Sheets file.
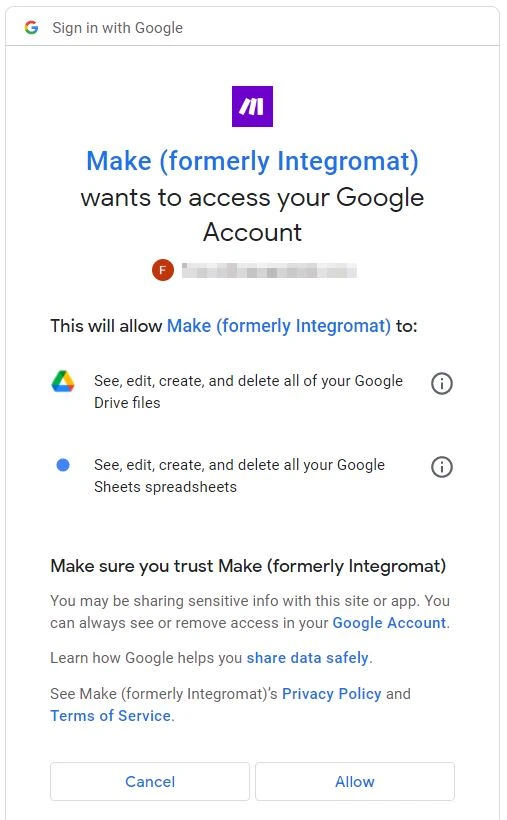
7 – Click on Allow. Make asks permission to access your Google account. This is standard procedure. The window closes after clicking it.
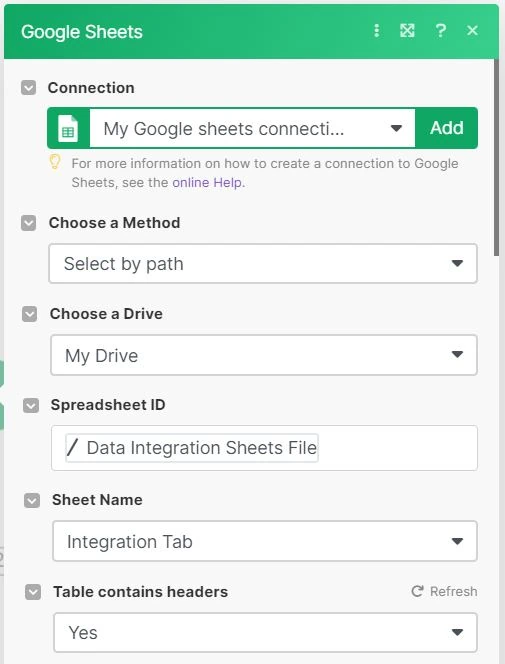
Back in Make you add the additional parameters.
8 – Under Choose a Method, choose Select by path.
9 – Under Choose a Drive, select My Drive. The spreadsheet you created earlier is likely located here.
10 – Under Spreadsheet ID, select the Google Sheets file you created earlier. Find the name you gave it.
11 – Under Sheet Name, select the Google Sheets tab from earlier. Find the name you gave it.
12 – Under Table contains headers, select Yes.
After which, the Values are created.
13 – Under Values is where it gets tricky. The headings from the Google Sheets file are the parameters where you decide the values. Once you click on the field, you’re presented with different parameters. Don’t be overwhelmed. Read the context of the parameters to know which one is mapped to which.
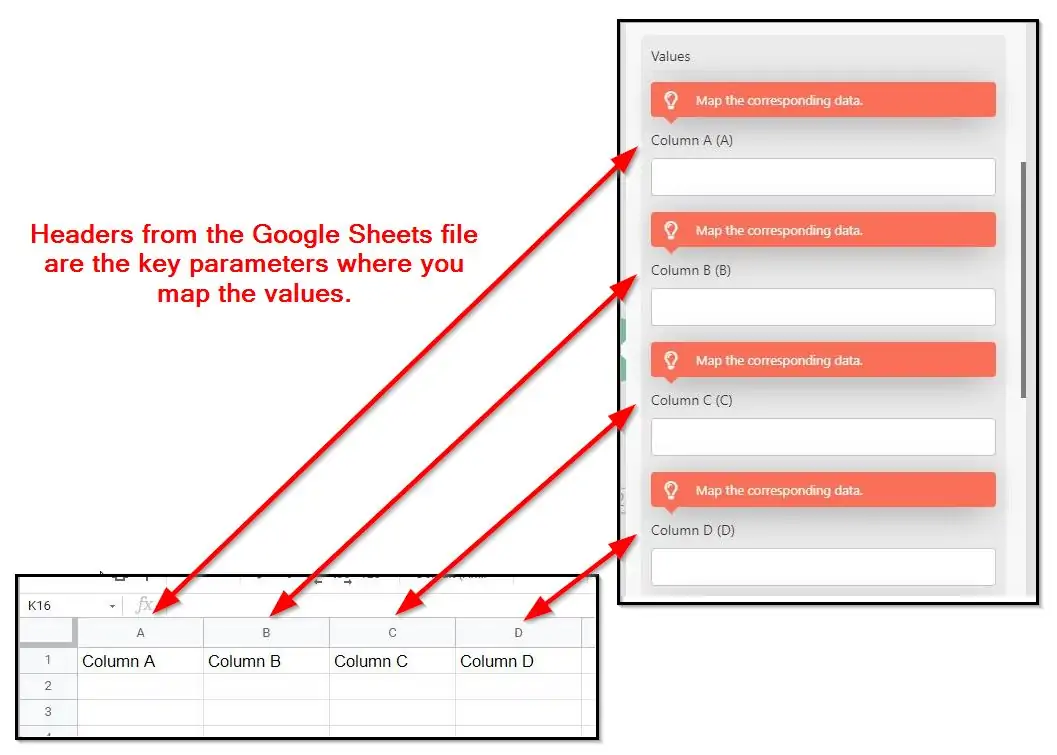
Under (A), select Campaign name.
Under (B), select Clicks.
Under (C), select Impressions.
Under (D), select Reach.
The parameters that appear here are from the connection you added earlier. Other parameters are also available. Make sure to add an extra column and name it on the Google Sheets spreadsheet so on and so forth.
14 – Click on Ok. Now it’s time to run and process the integration.
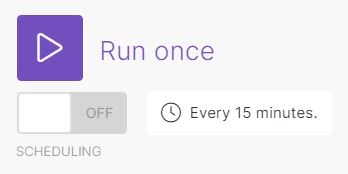
15 – Click on Run once with a play button icon.
A spinning wheel and a Log on the bottom right appear. Wait for the integration to finish. How long the integration takes depends on the Maximum number of results you select. It’s finished when a) green checkmarks appear, and when b) The scenario run was completed appears in the Log.
Go to your Google Sheets file and you now see the campaign data successfully exported from Facebook. Viola! Congratulations you imported Facebook Ads data to Google Sheets with complete information! You may also add other parameters or fields if you need them.
Schedule Automation and Reports
Make can schedule the automation based on cycles. The schedule is up to you.
1 – On the screen, click on the Scheduling button and turn it on.
2 – Under Run scenario, select the schedule you need. What you select on this parameter dictates the next ones.
If you select At regular intervals, you need to select the minutes that Make processes the automation.
If you select Once, you need to select the date.
If you select Every day, you need to select the time.
If you select Days of the week or Days of the week, you need to select the days.
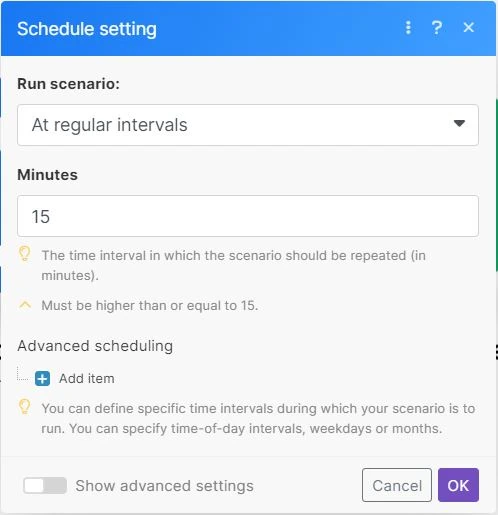
3 – Click on Ok. Ignore any advanced settings for now.
Viola! Congratulations you’re automating Facebook ads reporting in Google Sheets!
How to Add User Permissions on Facebook
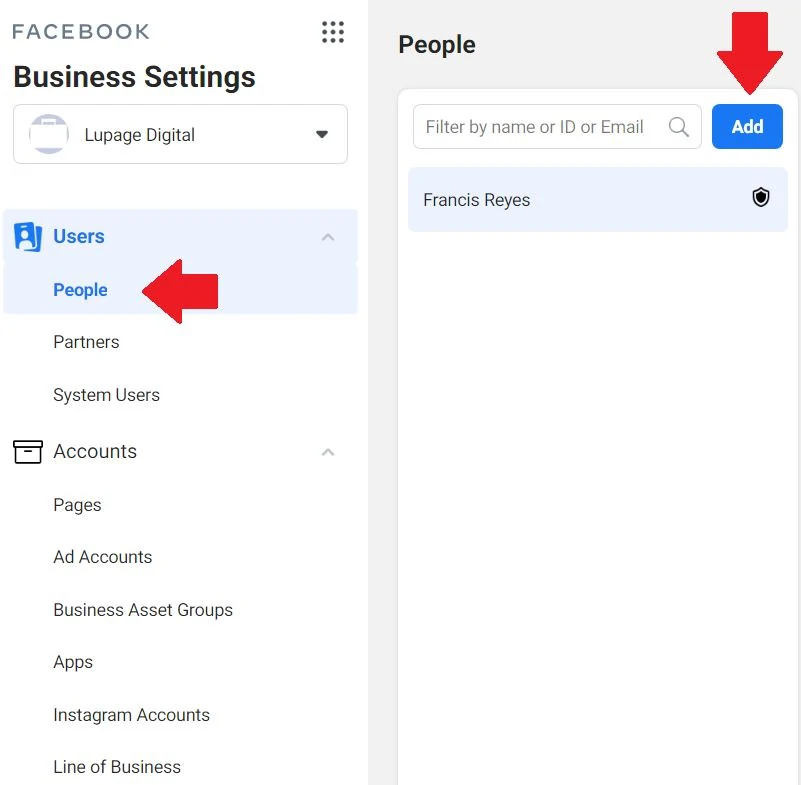
1 – Go to your Facebook Business Settings. Go to Users > People. Click on Add.
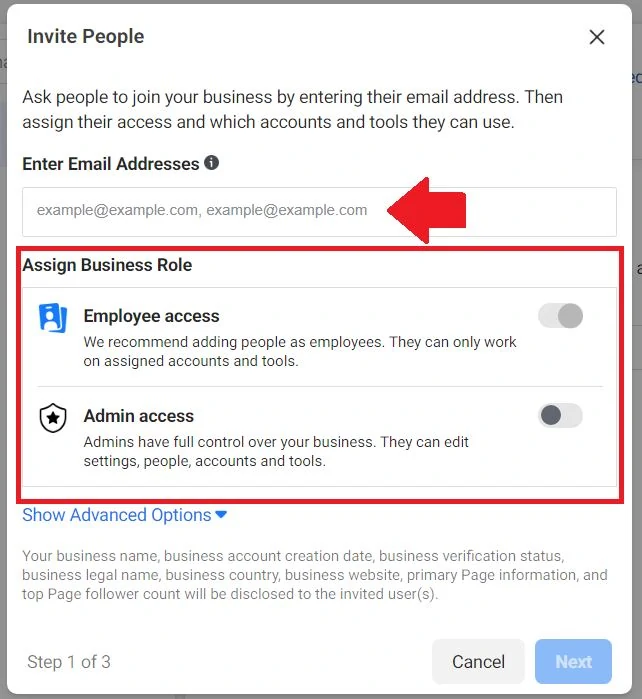
2 – Enter the email address that needs access to the data. It’s most likely yours. Access should be at least Employee access.
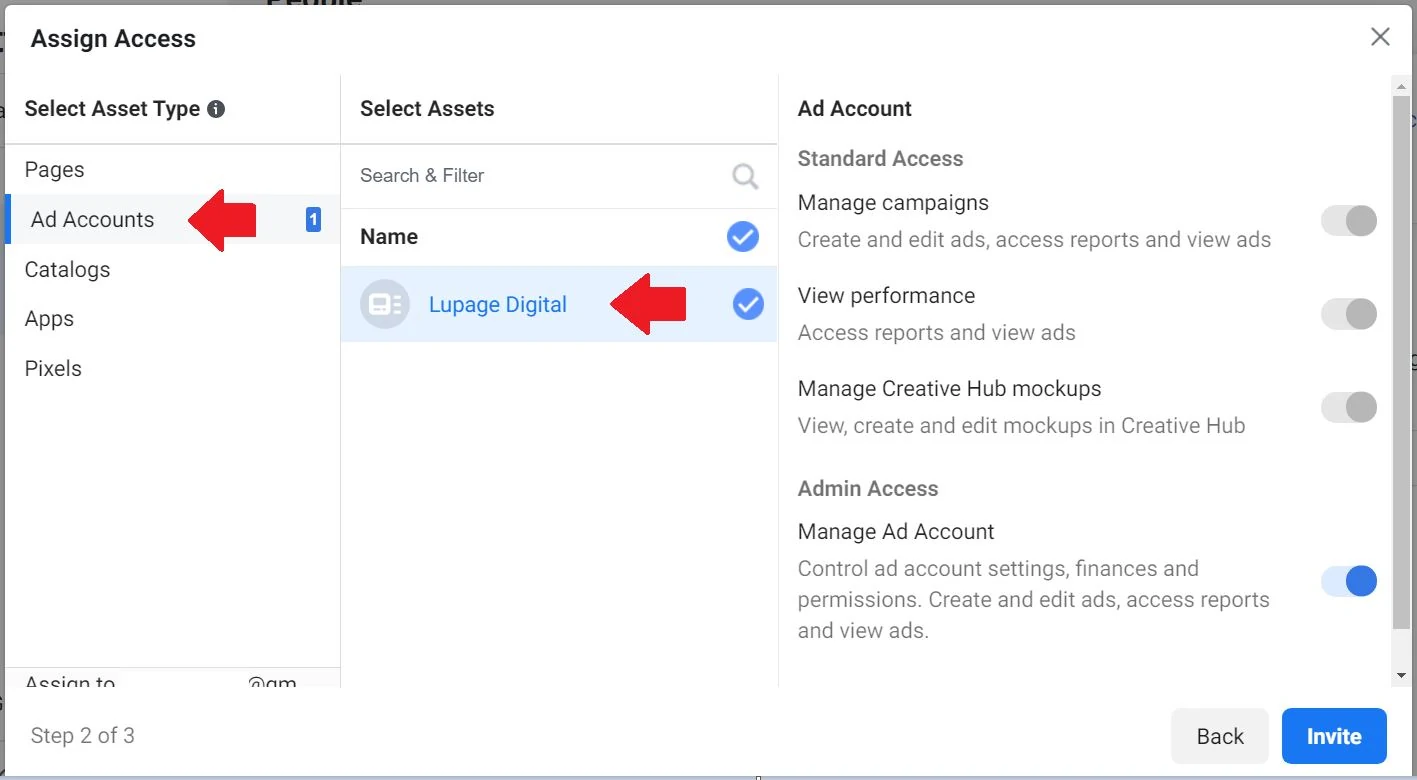
3 – Select the Ad Account. Then select the level of permissions.
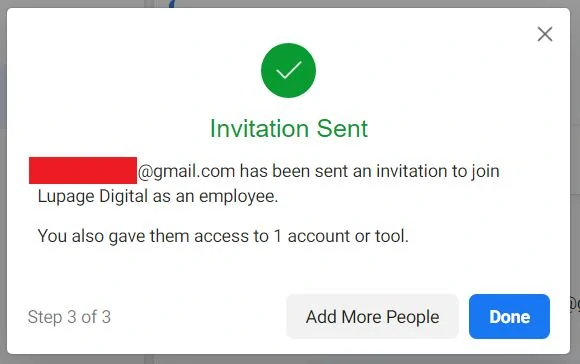
4 – The invitation is sent. The recipient should accept the invitation. That email now has access and now has the ability to import Facebook Ads data to Google Sheets.
Examples of Facebook Ads Metrics
Tracking the right Facebook Ads is crucial for optimizing your marketing efforts and maximizing ROI. You can fine-tune your campaigns by focusing on the key metrics for each ad type. Allocate your budget and drive better results. Whether you’re running conversion ads or retargeting campaigns, monitoring performance ensures that you make data-driven decisions for growth.
Here are examples of Facebook Ads that are important in reports:
Cost Per Result (CPR)
Measures the cost of achieving a specific result (e.g., lead, purchase, or sign-up). It determines the efficiency of ad spend.
Clicks (Link Clicks)
The total number of times people clicked on the ad’s link. It determines gauge interest and engagement.
Link Click-Through Rate
Indicates how many people clicked on the ad link compared to how many saw it. A higher CTR suggests engaging content and targeting accuracy.
Conversion Rate
Measures the percentage of users who take a desired action after clicking an ad. Essential for tracking ROI and ad effectiveness.
Impressions
The number of times an ad is displayed. It helps assess brand exposure and visibility.
Cost per Impression (CPM)
The cost of 1,000 ad impressions. Useful for comparing the efficiency of different campaigns.
Reach
The number of unique users who see an ad. Indicates potential audience size and brand awareness.
Return on Ad Spend (ROAS)
Measures revenue generated per dollar spent on ads. A key indicator of profitability.
Frequency
The average number of times an individual sees an ad. High frequency can indicate ad fatigue, which may reduce effectiveness.
Landing Page Views
The number of users who click the ad and successfully load the landing page. Ensures that users are reaching the intended destination.
Post Engagement Rate
Measures interactions such as likes, shares, and comments. High engagement signals strong ad relevance and audience interest.
Ad Relevance Score or Quality Ranking
Facebook’s rating of an ad’s quality and engagement. Higher scores lead to lower costs and better placement.
Cost per Click (CPC)
The average cost of each ad click. It helps track ad cost efficiency and adjust bidding strategies.
Cost per Lead (CPL)
The cost of acquiring a new lead. Crucial for businesses focused on lead generation and customer acquisition.
Why Export Facebook Ads To Google Sheets
Exporting Facebook Ads data to Google Sheets can enhance your analysis and reporting, especially when it is integrated with Google Analytics services.
Automate Facebook Ads Reports
Automating Facebook Ads reports by exporting data to Google Sheets streamlines the reporting process for marketers. With real-time data updates, teams can access the most current performance metrics without the hassle of manual data entry, saving valuable time.
This efficiency allows marketers to focus on strategy, leading to more informed decisions about their ad campaigns. In addition, the centralized reporting in Google Sheets makes it easy for stakeholders to access and review important metrics in one location.
Consolidate Data for Analysis
By exporting Facebook Ads data to Google Sheets, you can create a centralized location for all your marketing metrics. This can be helpful when comparing performance across different marketing channels. You can integrate the data from Google Sheets with Google Analytics data, allowing for a broader analysis of campaign effectiveness.
Compare Performance Metrics
With both Facebook Ads data and GA4 in Google Sheets, you can compare performance metrics seamlessly. For example, you can analyze how traffic from Facebook Ads converts compared to organic or other paid traffic tracked by Google Analytics.
This allows you to assess the return on investment (ROI) for your Facebook Lead Ads against the overall customer journey as tracked by Google Analytics.
Visualize Data
Google Sheets can be used to create charts and graphs that visualize trends and performance insights from both Facebook Lead Ads and Google Analytics. This helps in better understanding customer behavior and campaign effectiveness.
By merging data from both platforms, visual reports can provide insight into which advertising channels yield the best results in terms of conversions, user engagement, etc.
Understand Cross-Channel Attribution
You can gain insights into user attribution across various channels by analyzing data from both platforms together. For example, how many users saw your Facebook Ad creatives and later visited your site through organic search or directly.
This helps in understanding customer touchpoints and adjusting marketing strategies accordingly.
Gain Enhanced insights
Using Google Analytics, you can explore user behavior after they interact with your Facebook Ads. For example, you can track metrics such as bounce rate, pages per session, and conversion paths after clicks on Facebook Lead Ads.
This could lead to actionable insights that can optimize future ad campaigns based on how users engage with your website after interacting with ads. You can also use the consolidated data help SEO migration consultants.
More articles on automation:
Import Facebook Page Insights to Google Sheets
Import LinkedIn Page post data to Google Sheets
Import LinkedIn Ads API data to Google Sheets
Import Search Console Data to Google Sheets
Import WooCommerce data to Google Sheets
Import Facebook Ads data to Google Sheets
Import Google Ads data to Google Sheets
Import Mailchimp data To Google Sheets
Import Shopify data to Google Sheets
Import TikTok ads to Google Sheets
Import GA4 data to Google Sheets
Import ChatGPT to Google Sheets
Import JSON to Google Sheets
Export Gmail to Google Sheets
Conclusion: Create Facebook Reports Faster
Connecting Facebook Ads data to Google Sheets while integrating it with Google Analytics can provide comprehensive insights into marketing performance, enabling better decision-making and optimized advertising strategies. It fosters a holistic view of how various channels affect customer behavior, improving overall marketing efficacy.